Children’s Budget Report Finds Utah's Education Budget Fell Last Year, Even Before Accounting for Enrollment Growth
Voices for Utah Children, the state’s leading children’s policy advocacy organization, released its biennial ![]() Children’s Budget Report on Tuesday, February 19, 2019 at the State Capitol. The report, published every other year, measures how much (before and after inflation) the state invests every year in Utah’s children by dividing all state programs concerning children (which add up to about half of the overall state budget) into seven categories, without regard to their location within the structure of state government. The seven categories are as follows, in descending order by dollar value (adding state and federal funds together):
Children’s Budget Report on Tuesday, February 19, 2019 at the State Capitol. The report, published every other year, measures how much (before and after inflation) the state invests every year in Utah’s children by dividing all state programs concerning children (which add up to about half of the overall state budget) into seven categories, without regard to their location within the structure of state government. The seven categories are as follows, in descending order by dollar value (adding state and federal funds together):
- Education, which makes up 90.8% of the state-funded portion of the Children’s Budget and 77.3% overall counting both state and federal funds
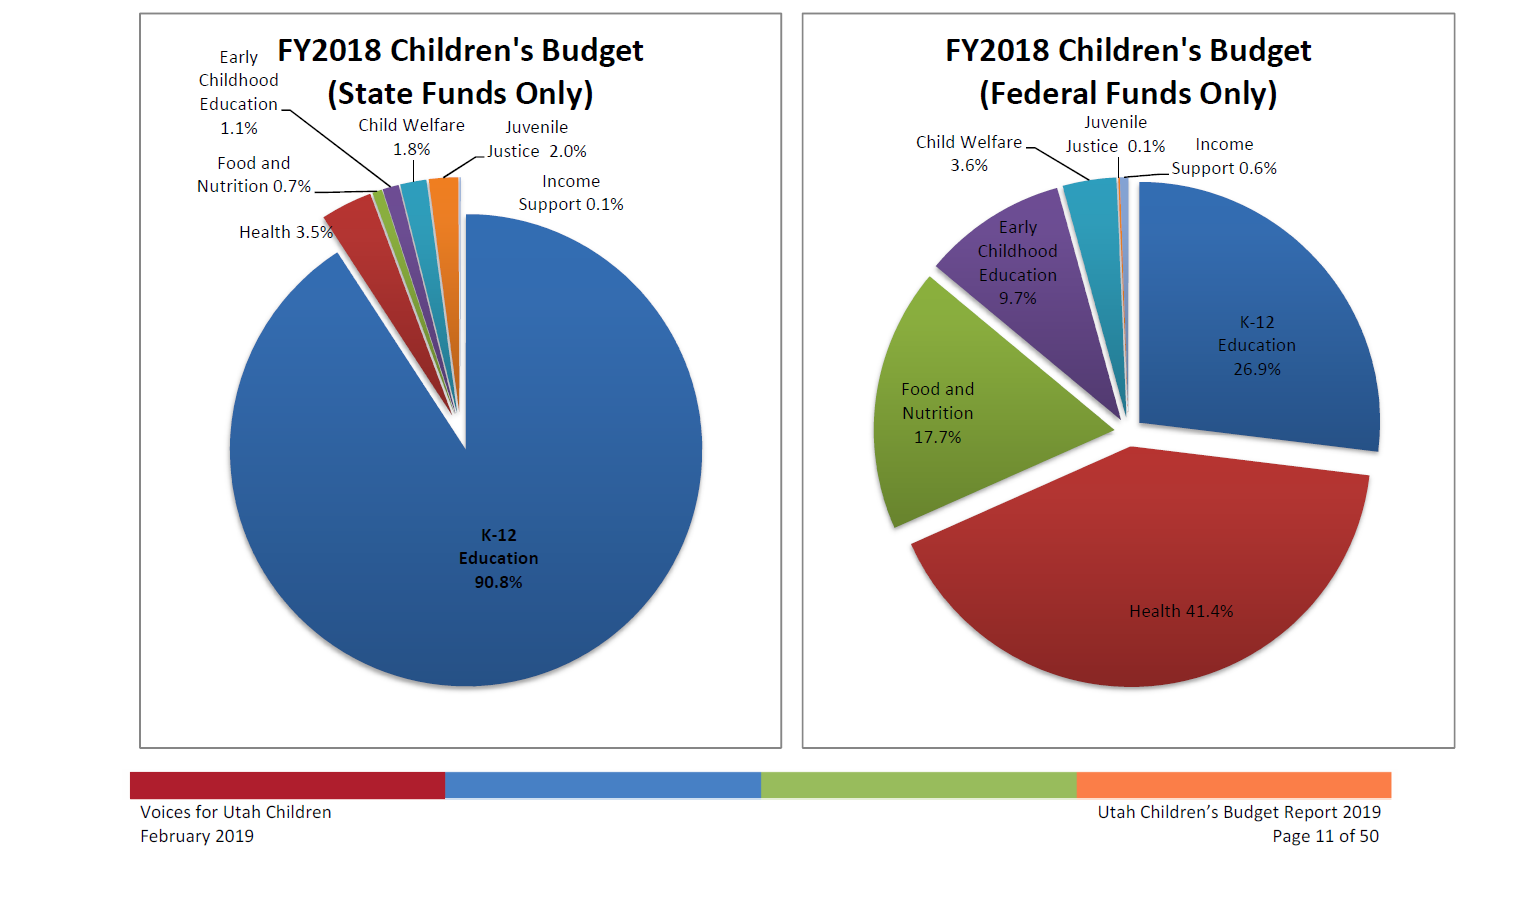
- Health – 3.5% of the state-funded portion and 11.5% overall
- Food and Nutrition – 0.7% of state-funded portion and 4.3% overall
- Early Childhood Education – 1.1% of state-funded portion and 2.9% overall
- Child Welfare -- 1.8% of state-funded portion and 2.2% of overall
- Juvenile Justice – 2.0% of state-funded portion and 1.6% overall
- Income Support – 0.1% of state-funded portion and 0.2% overall
Report highlights are as follows:
- Page 7-8: The state-funded portion of the Utah Children’s Budget peaked in FY2017 and then fell in FY2018 both overall and on a per-child basis.
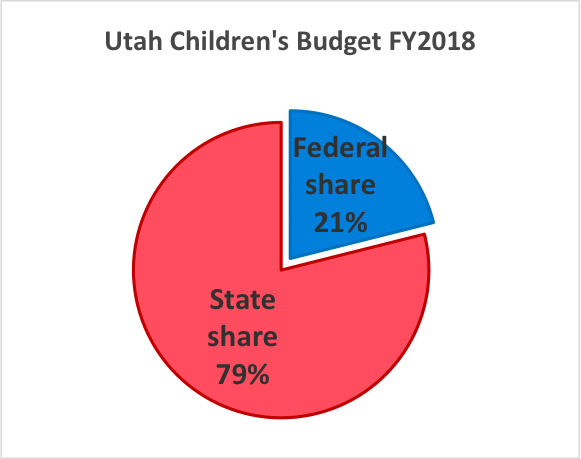 Page 10: 79% of the Utah Children’s Budget is from state funds, 21% from federal.
 - Page 11: Of the state-funded portion of the Children’s Budget, 91% is K-12 Education
- Page 13-14: Top areas for real state dollar increases 2008-2018 were:
- #1: Education = $1.015 billion (21.5% increase) (compared to a 21.3% increase in student enrollment)
- #2: Health Care = $90 million (67% increase) (compared to federal increase of $394 million/129%)
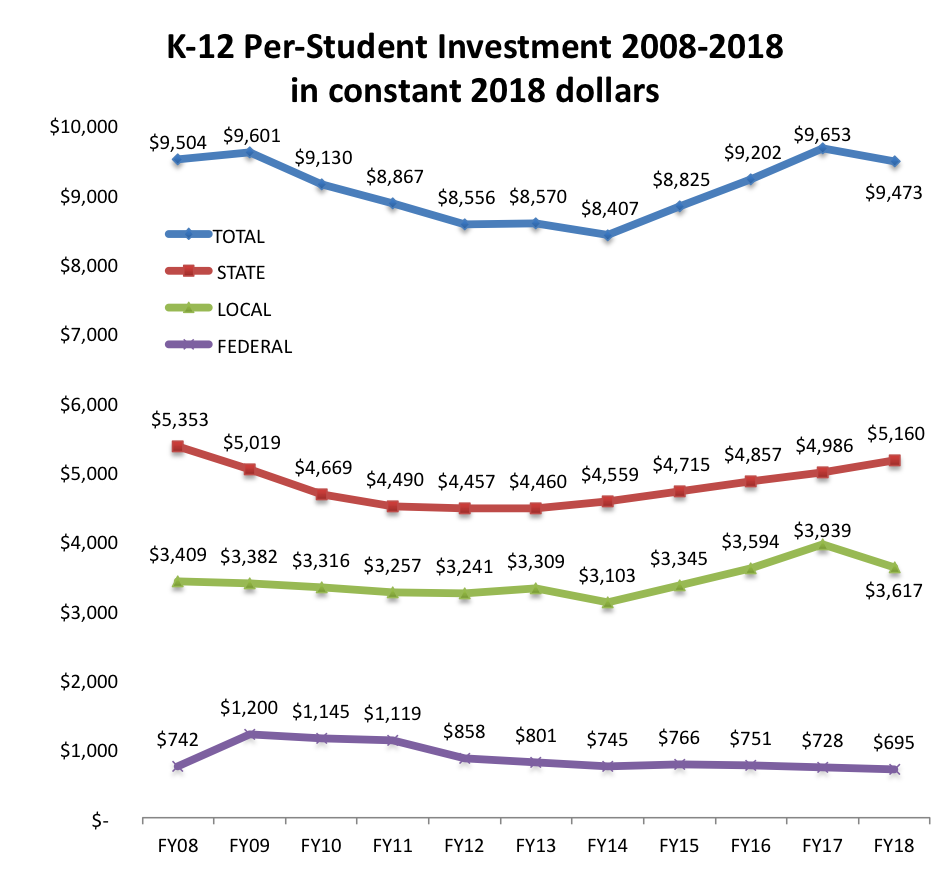
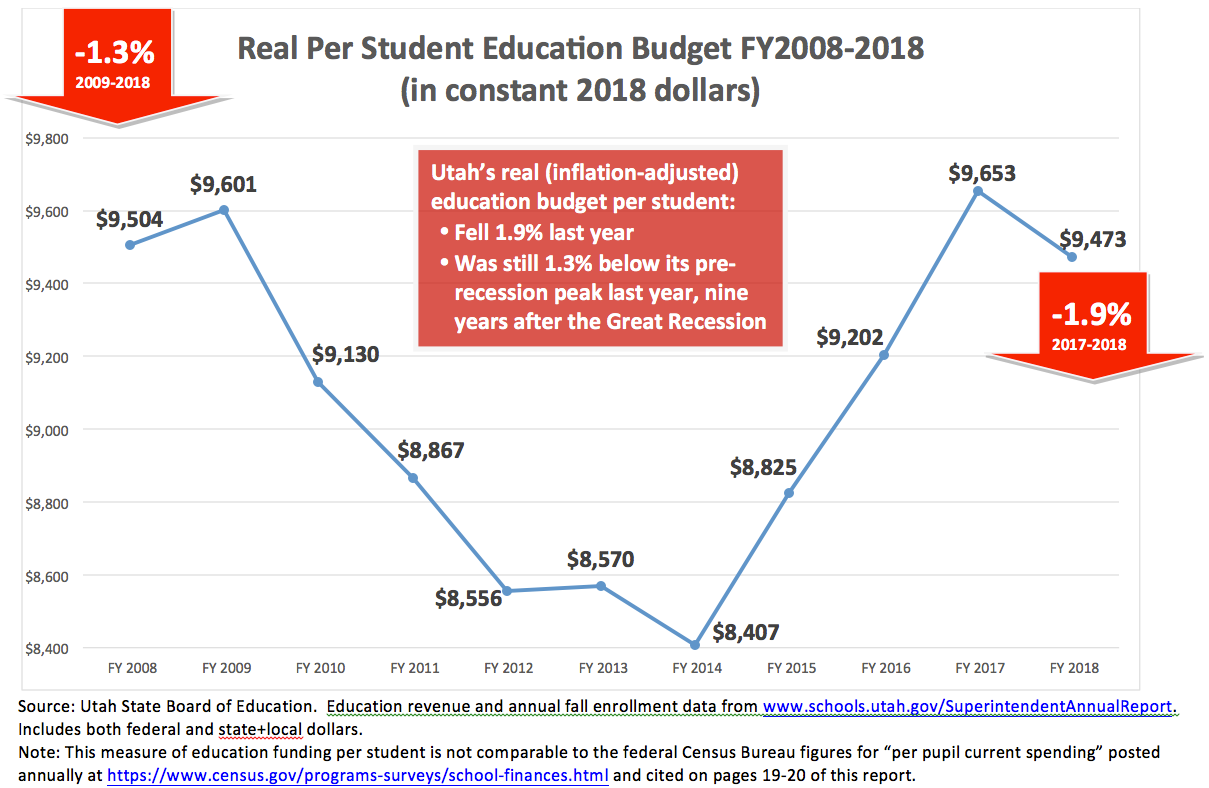
- Page 17: K-12 Education funding has not kept up with inflation and the increase in student enrollment. On a per-student basis, the total real-dollar investment per student fell 1.9% last year (FY2018 compared to FY2017) and remained 1.3% below its FY2009 pre-Great Recession peak.
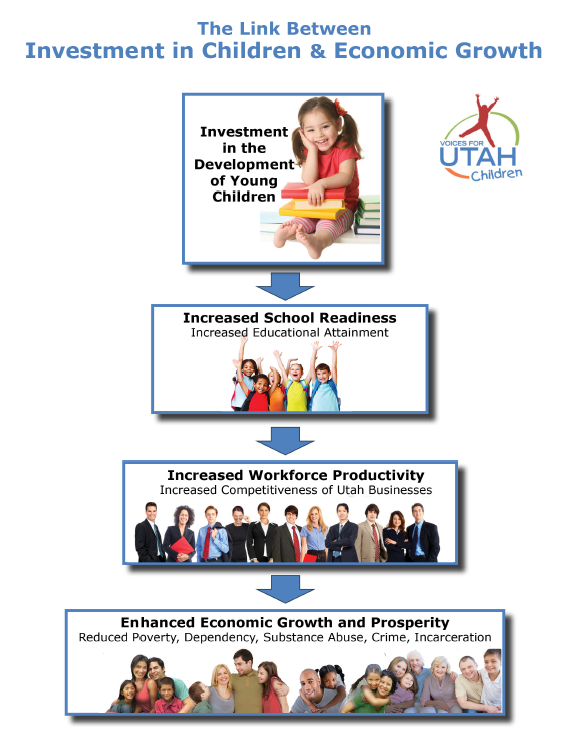
Patrice Schell, State Priorities Partnership Fellow with Voices for Utah Children, commented, “The Report makes the case that public investment in children should be understood as a central component of Utah’s economic development strategy. Examining how much Utah invests in children can help the state evaluate whether it is maximizing the potential of our future workforce through our investment in human capital. Especially at a time of rapid demographic change in our state, when minorities comprise 26% of our child population (one-quarter of our future workforce), and when majority-minority gaps have begun to appear at a scale unprecedented in Utah history, investment in the next generation is more critical than ever.”
The report’s most important findings are as follows:
GOOD NEWS: Utah is investing more in the next generation now than we were before the Great Recession of 2008-2009, both overall and on a per-child basis. On an overall basis, after accounting for inflation, the state-funded portion of the Children’s Budget is 21.6% above where it was in 2008 – a real increase of $1.1 billion (see page 8). On a per-child basis, it has risen $656 or 9% (which is less than the overall increase because the state’s child population rose 11.6% over that time period) (see page 7).
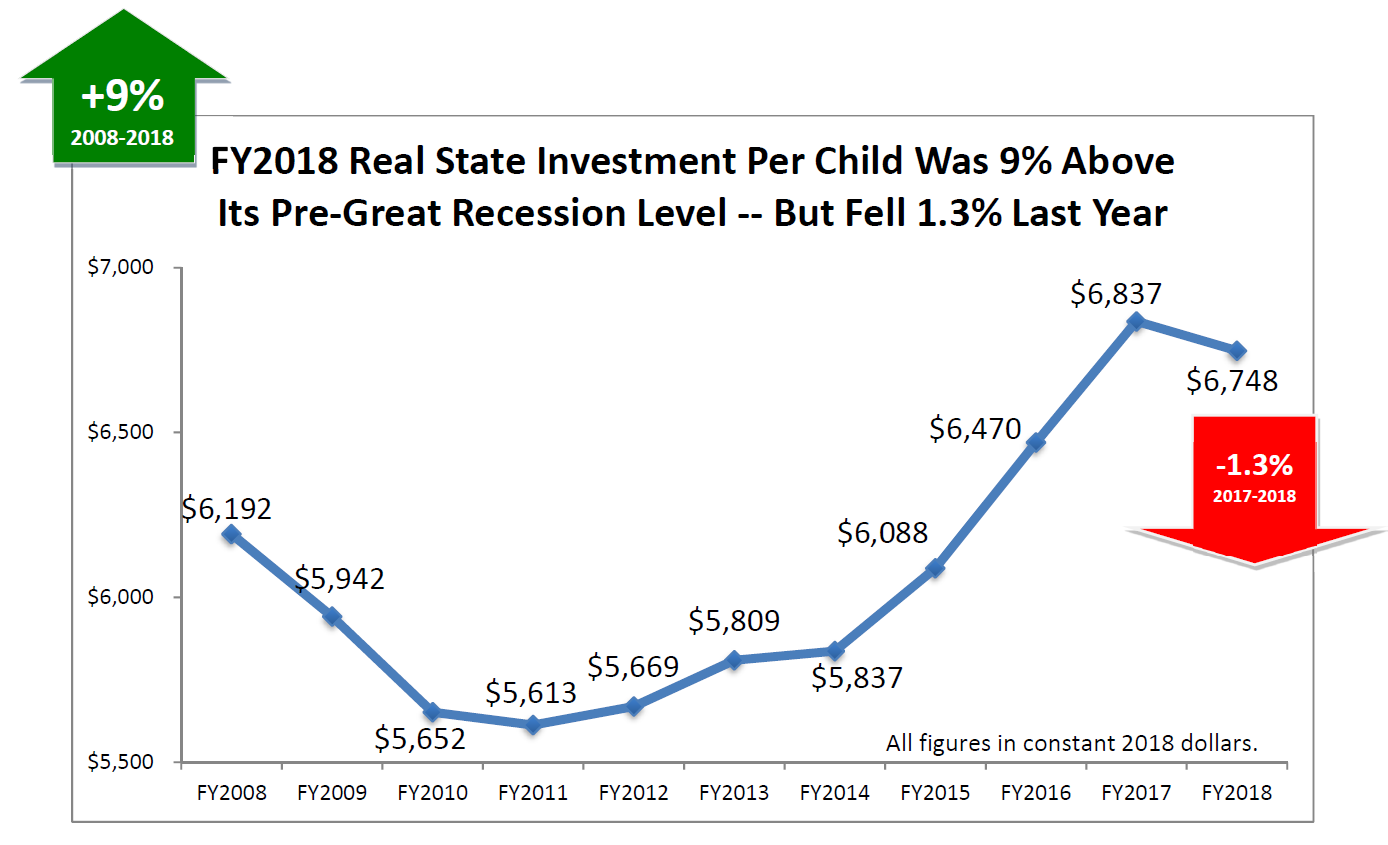
NOT-SO-GOOD NEWS: The Children’s Budget peaked in FY 2017 and fell last year by 0.5% overall and by 1.3% on a per-child basis (see page 7).
BAD NEWS: In spite of the state’s putting 91% of all new Children’s Budget dollars into K-12 education over the last decade, the K-12 education budget fell last year in real terms both overall for the first time in seven years (by $41 million – see page 15) and on a per-student basis by 1.9%, leaving it 1.3% below its pre-recession peak, even after nine years of economic expansion. See pages 17-18 for the data and for a discussion of the demographic and educational shifts that the state has not yet been able to catch up with.
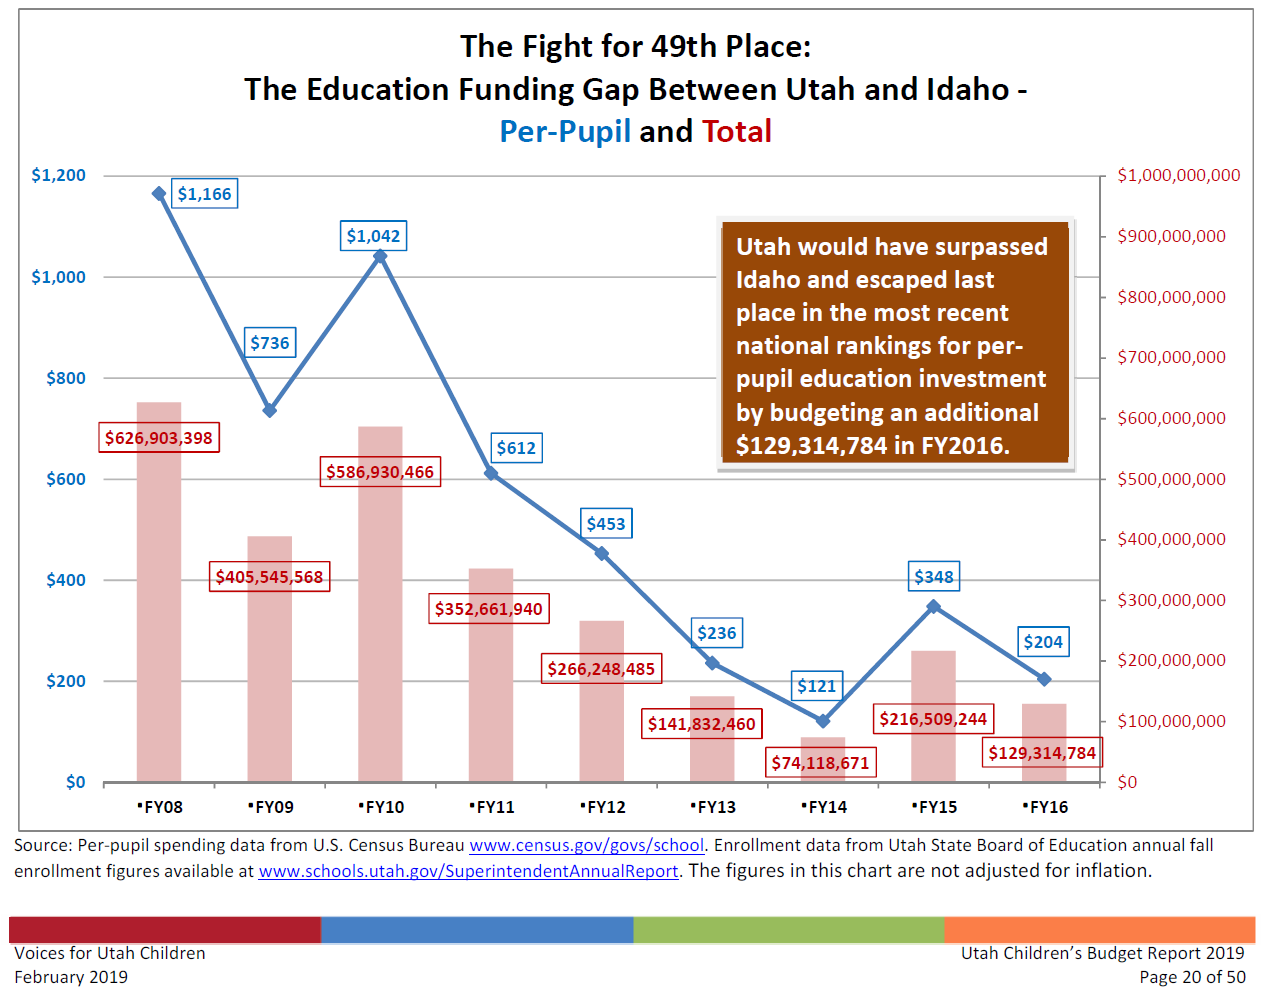
The report also includes information about Utah’s national ranking for K-12 education investment. Last May the U.S. Census Bureau reported that Utah remains in last place for per-pupil education spending, as illustrated in the report in a chart on page 20.
Report author Matthew Weinstein, State Priorities Partnership Director with Voices for Utah Children, commented, “As the Legislature considers using a temporary fiscal surplus to make permanent tax cuts of hundreds of millions of dollars, we urge caution, especially in light of the findings of this report. With many economists predicting a recession in the coming fiscal year, we hope policymakers will consider the long-term value of investing in Utah’s children and carefully weigh how best to ensure the prosperity and success of our state.”
The report was co-authored by University of Utah Economics Department student Nathan Kunz with support from the University of Utah Undergraduate Research Opportunity Program.
![]() The full 50-page report is available in pdf form at this link.
The full 50-page report is available in pdf form at this link.
Some additional detail regarding trends in state, local, and federal funds for K-12 education: