About Us
Juvenile Justice
Why We Advocate for Juvenile Justice Reform in Utah
Our team at Voices for Utah Children is proud to support juvenile justice reforms in Utah that are more effective and efficient for all involved. Recently, we’ve actively engaged in advocacy for reform since 2016, when state leadership embarked on a full-scale evaluation of Utah’s juvenile justice system at that time.
As the executive, legislative and judicial branches of government convened a wide-ranging group of experienced professionals and system experts, Voices joined with multiple other community-based non-profit organizations to articulate “Guiding Principles for Juvenile Justice Reform in Utah.”
Our number one guiding principle for reform was to “promote the critical role of early, non-criminal-justice intervention in the lives of young people, for the purpose of avoiding future justice involvement.”
This principle leads us to approach juvenile justice policy analysis and advocacy not by asking, “What is wrong with these kids?” but by asking, “What is going on with these kids?”
The vast majority of young people engaged in misconduct are acting out due to underlying issues that have not been addressed, such as:
- Serious childhood trauma such as sexual, physical and emotional abuse, including harms caused by another child;
- Undiagnosed and unsupported learning disabilities or mental health issues;
- Homelessness and housing insecurity;
- Family disruptions resulting in lack of support and supervision, such as substance abuse by primary guardians or absence of caring adults due to refugee or immigration status;
- Food insecurity and other poverty-related challenges; and more.
Why Early Intervention?
Ensuring early intervention is the most cost-effective and productive way to ensure that children never engage in criminal activity to begin with. This is the best path not only for a young person who might have otherwise harmed other people and their own community, but for those who might have been harmed.

(From Utah Juvenile Justice & Youth Services FY2022 Presentation)
Our communities are safest when children don’t act out in the first place. That is one reason that our organization advocates so strenuously for all Utah children to have access to food, shelter, health care and early education opportunities. These are preventative factors.
We also advocate for public policies that engender greater stability in the homes of young people, so they have fewer risk factors for antisocial behavior. Such policies include cash assistance for struggling families with children, access to health care for adults in the household, and help finding and paying for quality childcare so parents can work.
Harshly punishing young people with hundreds of hours of community service, fines they can’t pay, or isolation in a locked detention facility with other troubled children does not cultivate a sense of accountability and remorse.
In fact, over-punishment can actually make children more likely to reoffend, which is terrible for public safety.
Providing early access to interventions for young people who are struggling produces much better results. Harsher penalties also do not actually help those harmed by a youth’s antisocial behavior. A better approach is to ensure that as many young people as possible have their basic needs met, so their reasons for acting out are greatly diminished.
Children Are Not Adults
The juvenile justice system is structured differently than the adult criminal justice system, because children are not the same as adults. Research from the past several decades shows that the brains of most young people do not stop growing and developing until they are in their mid-20s. For this reason, our legal system has chosen to approach juvenile justice differently, with a greater emphasis on intervention and rehabilitation.
Most teenagers get into trouble for something during their formative years. Shoplifting, sexting, experimenting with drugs, getting in physical fights and skipping school are common mistakes made by young people finding their way into adulthood. Penalties for children should take into account that almost every human being does “dumb stuff” while growing up. Over-criminalization of these behaviors do not prevent young people from getting lured into them. Teenagers rarely know the legal penalties for their misconduct, and they lack the judgment to fully weigh how their future will be impacted by their behavior.
Disparities in the System
One serious issue that juvenile justice reform in Utah still has not been able to address, are the dramatic racial disparities that occur at each step of our juvenile justice system.
Research shows that children of color are much more likely to receive harsh penalties for misconduct than their white peers. What is understood as “age appropriate acting out” when a white child does it, is more often interpreted as “evidence of criminal character” when that very same behavior is exhibited by a child or color.

(From Striving for Racial Equity in Utah's Juvenile Justice System, 2020)
We object to policy proposals structured around harsh penalties, because we know those penalties are much more likely to hurt children and families of color, due to persistent racial injustice in our society. We believe that moving forward in a different way offers the best chance to address these disparities.
A Better Way Forward
Not all misconduct can be addressed by low-level interventions. Some children cause serious harm to others. There are children who leave families mourning and in pain. Taking a life, or perpetrating sexual abuse, are serious crimes for which our most serious interventions, including detention and secure care, should be reserved. Those who are hurt by serious offenses deserve real support, such as counseling and financial support, not just dramatic penalties that risk creating public safety issues for others in the future.
We try to advocate for policies that are shaped by the most up-to-date research, expert recommendations and actual data. Sometimes, this information changes, and we must reshape the ways in which we pursue the most positive outcomes for children.
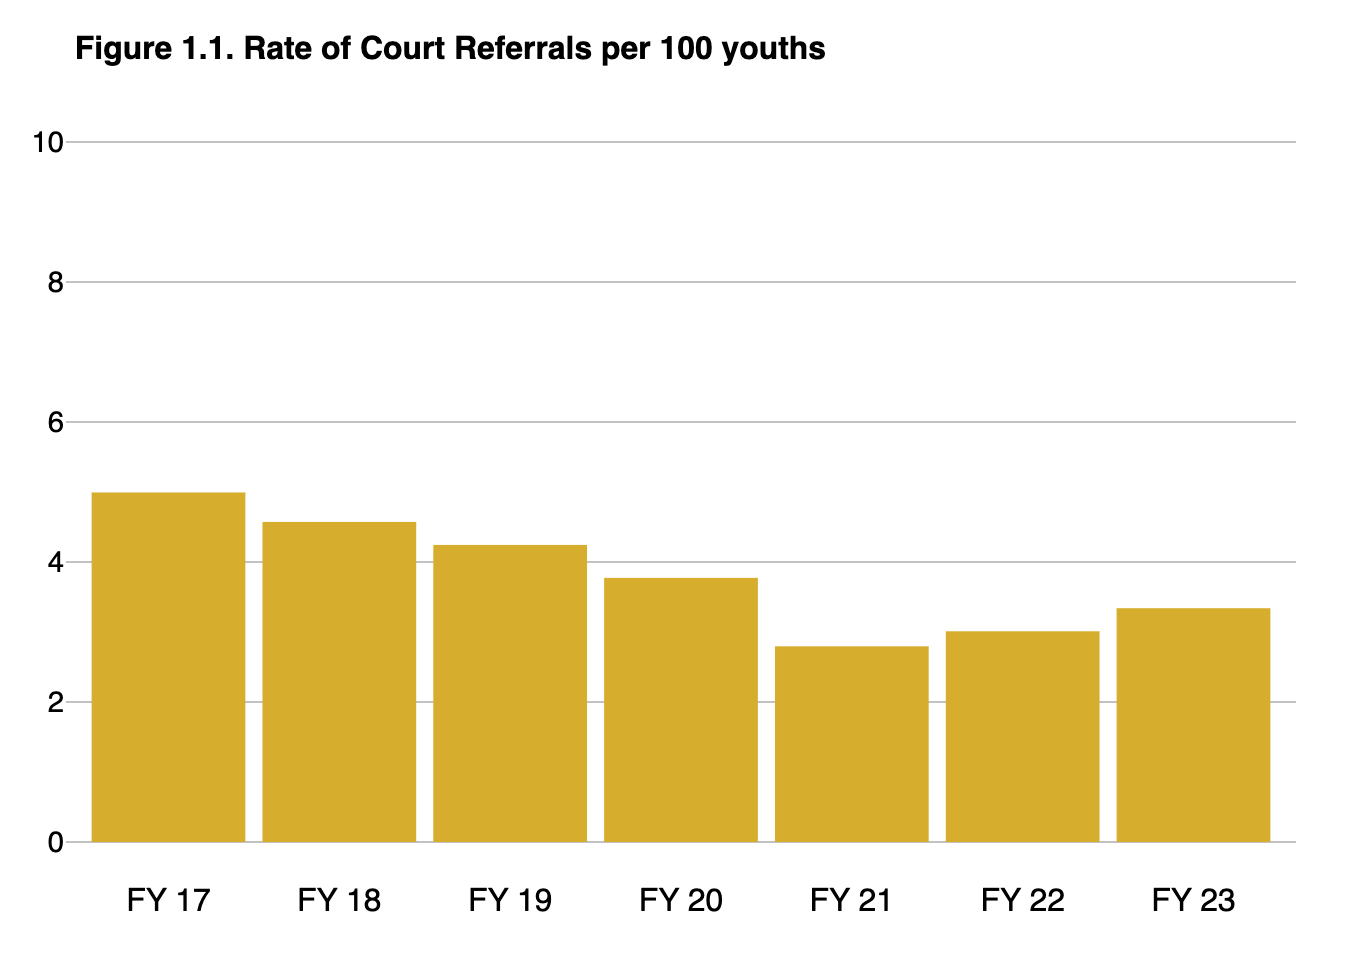
(From 2023 Juvenile Reform Report, System Trends 2023 Juvenile Reform Report, System Trends)
Our state’s own research shows that the “old way” of doing things is unnecessarily expensive, is ineffective at reducing reoffending, and is more likely to engender resentment than remorse. Going backward will not help Utah children. We have to keep moving forward, with new knowledge and best practices, in order to best serve our kids.
If you have questions about this blog post, please contact or anna@utahchildren. Annual Juvenile Reform Reports can be accessed through our state's Commission on Criminal and Juvenile Justice website here.
A Rough Legislative Session for Utah Kids (Again)
The 2024 Utah Legislative Session ended at midnight on Friday, March 1. For the Voices for Utah Children team, this session included supporting a lot of community engagement, working hard to protect the programs that protect Utah kids, and trying not to get distracted by outlandish efforts to "solve" problems that don't actually exist in Utah.
As usual, there were many, many missed opportunities for state leaders to improve the lives of Utah kids. Nonetheless, we managed to pull off some great victories - as always, in partnership with many supportive community members, our great partner organizations and supportive public servants.
We hosted six different public engagement events at the Capitol over seven weeks. Working closely with our community partners, we stopped some truly terrible legislation that literally threatened the lives of Utah kids who rely on Medicaid and CHIP. Thanks to many supportive child care professionals and working parents, we kept Utah's child care crisis in the media spotlight throughout the session.
For a deeper dive into our efforts in various policy areas, as well as a recap of what happened to the many different bills we were tracking, check out the virtual booklet below!
Our 2024 Legislative Agenda
At Voices for Utah Children, we always start with this guiding question: "Is it good for all kids?" That remains our north star at the outset of the 2024 legislative session, and is reflected in our top legislative priorities.
So, what’s good for all kids in 2024?
A Healthy Start!
A healthy start in life ensures a child's immediate well-being while laying a foundation for future success. We are steadfast in our commitment to championing policies that prioritize every child's physical, mental, and emotional well-being. Central to this commitment is our focus on improving Utah’s popular Medicaid and CHIP programs, which are pivotal in the lives of many Utah children and families.
This legislative session, a healthy start for kids looks like:
- Empowering Expectant Mothers: We support a proposal from Rep. Ray Ward (R-Bountiful) to increase access to health coverage for low-income and immigrant mothers-to-be.
- Increasing Access to Health Care: We support bills that aim to improve access to the vital healthcare services children and parents need, especially for those on Medicaid and CHIP.
- Protecting Health Coverage: We oppose any effort to defund, and exclude deserving children from, the Medicaid and CHIP programs that help thousands of Utah kids every year.
Early Learning and Care Opportunities!
The formative years of a child's life lay the foundation for their future, shaping their cognitive abilities, socio-emotional skills, and passion for learning. We will support efforts to increase access to home visiting programs and paid family leave, but ensuring consistent, quality, and affordable child care is our top priority.
This legislative session, early learning and care opportunities for kids looks like:
- Bolstering Access to Quality Child Care: We support the efforts of both Rep. Andrew Stoddard (D-Sandy) and Rep. Ashlee Matthews (D-Kearns) to extend the successful Office of Child Care stabilization grant program that has supported licensed child care programs statewide.
- Investing in High-Quality Preschool: We support an anticipated legislative proposal to streamline Utah’s existing high-quality school-readiness program and to make it available to more preschoolers statewide.
- Recruiting and Retaining Child Care Professionals: We support Rep. Matthews’ proposal to expand access to the Child Care Assistance Program for anyone working in the child care sector.
- Building New Child Care Businesses: We also support Rep. Matthews’ proposal to continue funding for work to develop and support new child care programs in rural, urban, and suburban areas.
To view a more comprehensive list of our 2024 early care and learning legislative priorities, click here.
Economic Stability for Families with Children!
Economic stability forms the bedrock of thriving families and vibrant communities. To ensure that young families in Utah have the support they need to afford basic necessities, we will advocate for increasing families’ access to Utah's earned income and child tax credits.
This legislative session, economic stability for families looks like:
- A Little Extra Help in the Early Years: We support HB 153, Rep. Susan Pulsipher’s (R-South Jordan) bill to expand Utah’s new Child Tax Credit, (currently only for children ages 1 to 3), to apply to children between 1 and 5 years of age. We also strongly recommend helping even more Utah families with young children by making the tax credit available for families with any child between birth and 5, and expanding it to include the thousands of lower- and moderate-income families who are currently excluded.
- Credit for Working Families with Kids: We support HB 149, Rep. Marsha Judkins’ (R-Provo) bill to expand Utah’s Earned Income Tax Credit so that more lower- and middle-income families with children can benefit.
Justice for Youth!
We want to ensure that all youth, including those who come into contact with the juvenile justice system, have access to interventions and supports that work for them and for their families. We are dedicated to advancing policies and recommendations that contribute to a more fair and equitable juvenile justice system for all Utah youth.
This legislative session, justice for youth looks like:
- Prioritizing School Safety: We are monitoring bills from Rep. Wilcox (R-Ogden) and the School Safety Task Force, including: HB 14, “School Threat Penalty Amendments” and HB 84, “School Safety Amendments.” We remain hopeful that these efforts will support a secure learning environment for all students, without contributing further to the School-to-Prison Pipeline.
Be an Advocate!
As we chart the path forward, one thing remains abundantly clear: the well-being, growth, and future of Utah's children rely on the decisions we make today. Each legislative session presents an opportunity—a chance to reaffirm our commitment, reevaluate our priorities, and reimagine a brighter, more inclusive future for all.
Together we can continue to make Utah a place where every child's potential is realized, their dreams are nurtured, and their voices are heard.
Below are some ways you can get involved this session.
Stay Informed with our Bill Tracker
Stay informed about important legislation we are watching and reach out to your local representatives to let them know how you feel about legislation that is important to you. We make it easy for you to subscribe and watch bills that you are most concerned about.
Join us for Legislative Session Days on the Hill
Join us at the Capitol, where we offer attendees the opportunity to engage in the legislative process on a specific issue area (health and/or child care). You'll have the chance to attend bill hearings, lobby your legislators, connect with fellow community advocates, and watch House and Senate floor debates. Click the button below for the dates/times of our meetings and to RSVP.
Celebrate Utah's Immigrant Community
In collaboration with our partners at UT With All Immigrants, the Center for Economic Opportunity and Belonging, and I Stand with Immigrants, we are organizing Immigrant Day on the Hill. Join us to discover ways to engage in Utah's civic life. Enjoy food, explore resource tables, participate in interactive activities, and entertainment. Everyone is invited to attend this free event!
Event Details: February 13, 2024, 3:30pm-5:30pm at the Capitol Rotunda, 350 State St, Salt Lake City, UT 84103
