Education
A Rough Legislative Session for Utah Kids (Again)
The Governor’s 2024 Budget: Hits and Misses for Utah Families
Governor Cox unveiled his budget last week, and the general direction of the budget is positive. Voices for Utah Children is interested in some specific components of the budget that directly impact Utah children and their families:
Public Education
$854 million increase, including a 5% jump in per-pupil funding and $55 million for rural schools
This is a much-needed investment in public education. We support the focus on rural schools and are anxious to see the details as they emerge. Public education consistently polls as a top priority for Utahns of all political parties and backgrounds.
Support for Utah Families
$4.7 million to expand Utah’s child tax credit and $5 million for accessible child care
We appreciate the fact that the Governor has begun to address the urgent needs of Utah families with young children. However, both allocations fall far short of the amount required to truly support and elevate these young families’ current needs. A truly impactful child tax credit would require an investment of at least $130 million, and the benefits in reducing child poverty in Utah would be substantial. Our recent report on child care in Utah clearly illustrates the need for bold action to support families in the workforce, who are struggling with the cost and unavailability of child care. The Governor’s $5M project will help very few Utah families and does not address the true need.
Housing
$128 million for homeless shelters and $30 million for deeply affordable housing
We support the Governor in his effort to better support the homeless residents of our state. We encourage a greater focus on expanding support for homeless children specifically. Early care and education opportunities for young children as well as more supportive programs for their parents and caregivers are critical to helping families find stable housing and better future opportunities. Investing in deeply affordable housing will help many Utah families.
Behavioral/Mental Health
$8 million for behavioral and mental health
This is not enough to address the current mental health needs of Utahns – in particular, those of our children and the folks tasked with raising them. We need more mental health professionals and greater access to services. We know this is a major concern for the Governor and we encourage increased strategic investment in this area.
It is also important to acknowledge and applaud some items the Governor wisely left out of his proposed budget:
No Proposed Tax Cuts
Utahns want to see more invested in our children while they are young, to prevent greater challenges later in life. It is our children who suffer most, when politicians toss our tax dollars away on polices that mostly benefit the wealthiest 1% of Utah households.
No Proposed Funding for Vouchers
Public funds should not be redirected to private entities. Utah needs an annual audit of the current program, to assess who is benefitting from school vouchers. In other states, the results are not good – vouchers are looking more and more like a tax break for wealthy families.
Bold Investments Needed for Utah's Children
Governor Cox's budget focuses on increasing funding for education, families, and affordable housing.
These are all areas where we believe bold investment is needed. We support the Governor in addressing these issues, but cannot overlook how this budget falls short in the face of the ongoing struggles faced by Utah families with children.
We encourage our Legislature to use the Governor’s budget as a roadmap and increase the allocations to the amount needed.
Our 2024 Legislative Agenda
Utah Children's Budget 2023
The care for the children in our state and communities can be measured by our public investment in our smallest humans. From the fiscal year 2008 to 2022, Voices for Utah Children divided all state programs concerning children into seven categories, without regard to their location within the structure of state government to quantify the level of public funding and identify trends. The seven categories are:
- K-12 Education
- Health
- Food & Nutrition
- Early Childhood Education
- Child Welfare
- Juvenile Justice
- Income Support
An appendix of our tables, sources, methodology and description of programs can be found here.
How Much We Spend
The interactive circle chart below compares how much we spend by category, program, and source of funding, just use the filter and click the category to zoom in.
-
K-12 Education makes up 92% of the state-funded portion of the Children’s Budget, while the federal-funded portion is more diversified across categories.
Spending Trends
We compare the budget to FY2008 because that was a peak year in the economic cycle before The Great Recession and all figures have been adjusted for inflation, so they are comparable across time.
- From FY2008 to FY2022, total public investment in children increased by 43%, growing much faster than Utah’s public-school enrollment (district & charter schools) by 26%, or the child population ages 0-17 by 13% from 2008-2021.
The federal share of the Children's Budget has fluctuated between 18-26% but had its biggest increase at the beginning of the Great Recession and the Covid-19 Pandemic. This is also when state funding for the Children's Budget has declined, for example real state & local K-12 education funding fell by $206 million since FY2020, the largest two-year decline since the Great Recession in 2008-2010. Several years after the Great Recession the federal share of the Children’s Budget decreased and the state share started to increase again, something that will hopefully happen again as pandemic relief funding rolls back.
Funding Sources: Federal vs. State
When the categories are disaggregated by source of funding, Food & Nutrition, Income Support, Health, and Early Childhood Education programs are mainly funded by federal sources, and Child Welfare, K-12 Education, and Juvenile Justice programs are funded mainly by state sources. And since Amendment G passed and allowed the income tax to be used to fund programs for children (in addition to K-12 and some Early Childhood Education & Nutrition Programs), the Child Welfare, Juvenile Justice, and Health categories are funded primarily by the income tax. In FY2022, 98% of Juvenile Justice, 100% of Child Welfare, and 88% of Health categories of the state funded Children's Budget were funded by the income tax totaling to $475 M.
When examining the state-funded portion of the budget since FY2008 each category has a different story.
- Juvenile Justice programs declined the most in dollar amount, $32.9 M or 28% mainly due to a reduction in correctional facility and rural programs and it also had an increase in early intervention services which advocates consider to be a goal of juvenile justice reform.
- Child Welfare programs declined by 16% or $21.8 M, mainly from the Service Delivery program which funds caseworkers to deliver child welfare, youth, and domestic violence services.
- Income Support declined 49% or $2.1 M and appears to be more cyclical, rising and falling with the Great Recession. Interestingly, the TANF grant is a mix of state and federal funds, and only a small amount goes to Income Support or cash assistance.[i]
- Food & Nutrition increased by 56% or $19.7 M due to an increase in liquor & wine tax revenues which supports the school lunch program.
- Early Childhood Education had the largest percentage increase of 109% or $42.0 M mainly from the Upstart program but increasing in every program except Child Care Assistance.
- Health has increased by 80% or $139.3 M from the Medicaid and CHIP program but also had a 58% or $12.4 M decrease in Maternal & Child Health.
- The category that has increased the most in dollar amount is K-12 Education.
K-12 Education Funding
State and local sourced funding for K-12 education increased by $1.6 billion in constant 2022 dollars from FY2008 to FY2022, but per-pupil spending only increased from $10,212 to $10,537 per student. This means that even though more is being spent in total dollars, it barely covers the increase in students during the same time.
In 1948, 100% of the income tax was allocated to public education, an increase from 75% when it was originally imposed in 1931. It was expanded in 1996 to include higher education, in 2021 to include non-education services for children and people with a disability, and may be expanded again depending on a 2024 ballot measure placed by the Utah Legislature.
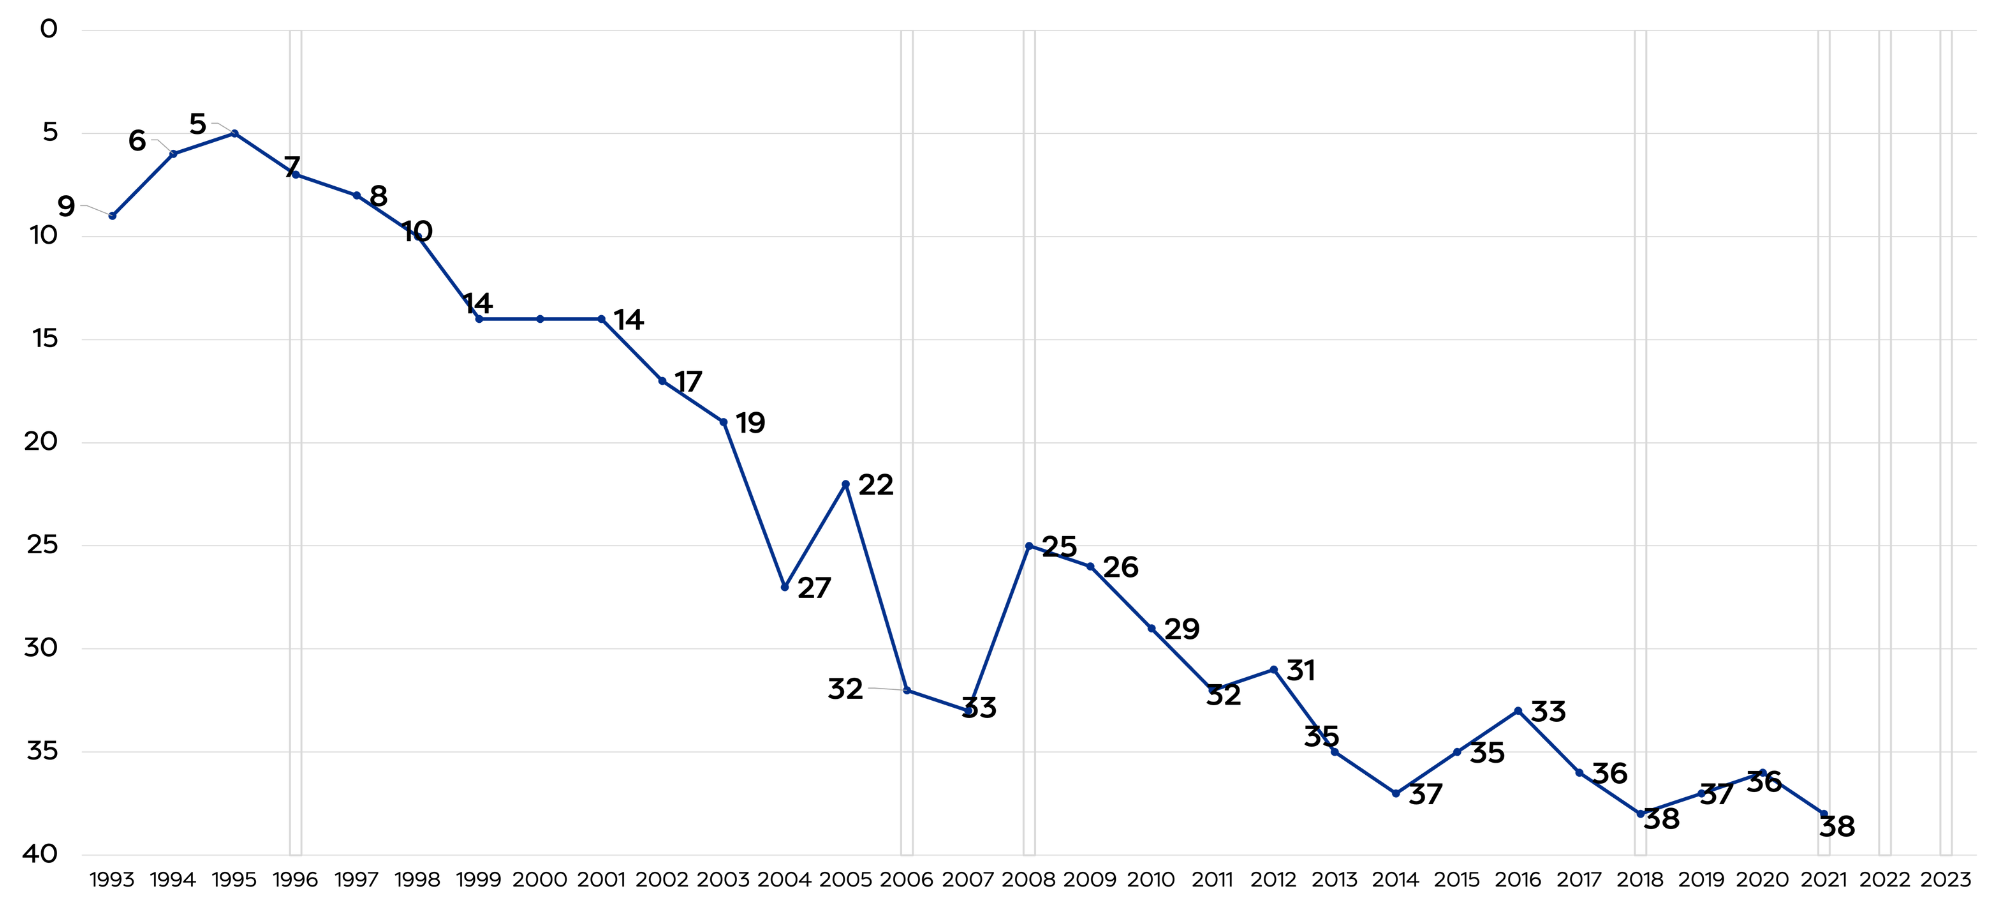
The income tax rate has been reduced in 1996, 2006, 2008, 2018, 2022, and 2023. The graphs below illustrate a timeline of these changes and Utah’s total elementary and secondary public schools (district & charter) funding effort (including capital) as a percentage of personal income and rank compared to other states.
Unfortunately, the result is a downward trajectory and likely explains our second to last place in per-pupil funding in the country.[ii]
Utah's Education Funding Effort as a Percent of Personal Income
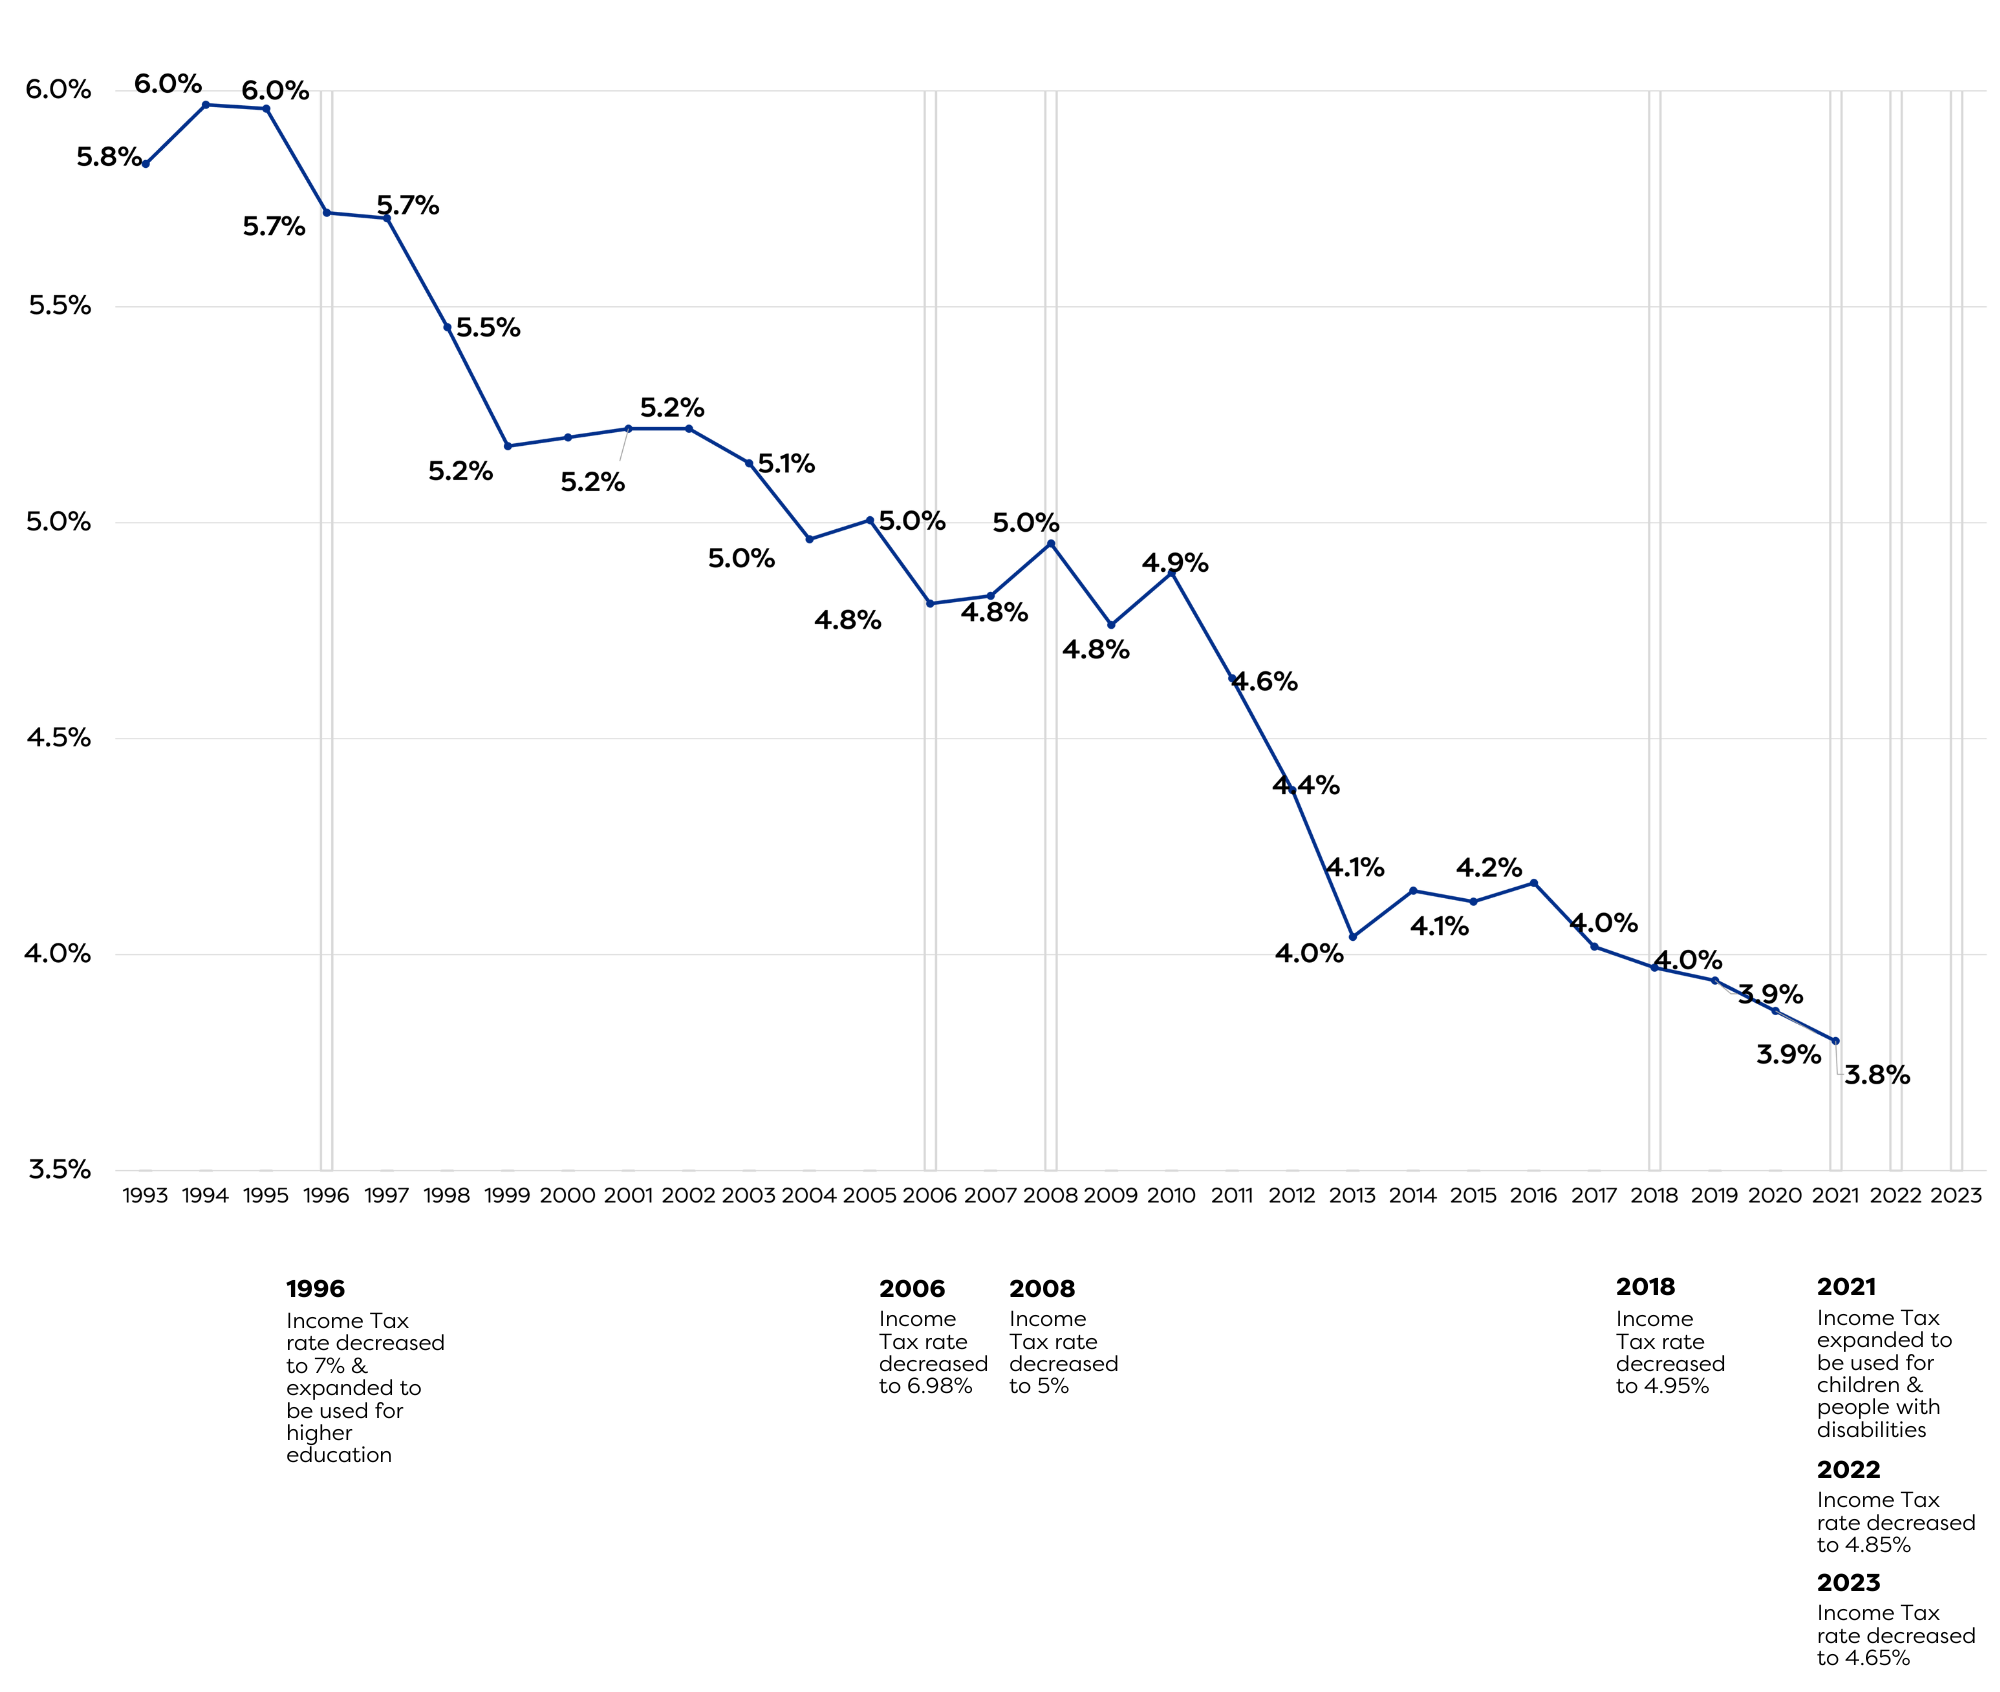
According to the fiscal notes, the last two bills that reduced the Income Tax rate in 2022 and 2023 estimated a loss of $1.3 billion in the Income Tax Fund from FY2022-2025 with more ongoing.[iii]
State & Local Funded Portion of K-12 Education
Another result of these changes has been shifts in the funding source for K-12 education. From the fiscal year 2008 to 2022, the federal-funded portion increased by 74% and the state-funded portion declined by 3%.
Meanwhile, Local sources have increased by 12%, possibly to meet the needs of their communities while state-funded sources decline and putting greater pressure on sources like the property tax which is more regressive than the income tax because it takes a greater toll on low-and middle-income families.
Rank of Utah's Education Funding Effort Compared to Other States
We Need to Prioritize Children in the Budget
While Utah doesn’t have the most kids than any other state, we do have the highest share of kids in our population. And we as a community are entrusted to make sure they are cared for, safe, and have the tools they need to achieve their aspirations. As the Utah Legislature drafts, holds hearings on, debates, and passes the Utah state budget we hope they prioritize our most vulnerable and precious group, Utah’s children.
[i] https://www.cbpp.org/sites/default/files/atoms/files/tanf_spending_ut.pdf
[ii] https://www.census.gov/programs-surveys/school-finances.html
[iii] https://le.utah.gov/~2022/bills/static/SB0059.html, https://le.utah.gov/~2023/bills/static/HB0054.html These fiscal notes show the loss from the income tax fund but they are not disaggregated by changes from the income tax rate or tax credit portion of the bills.
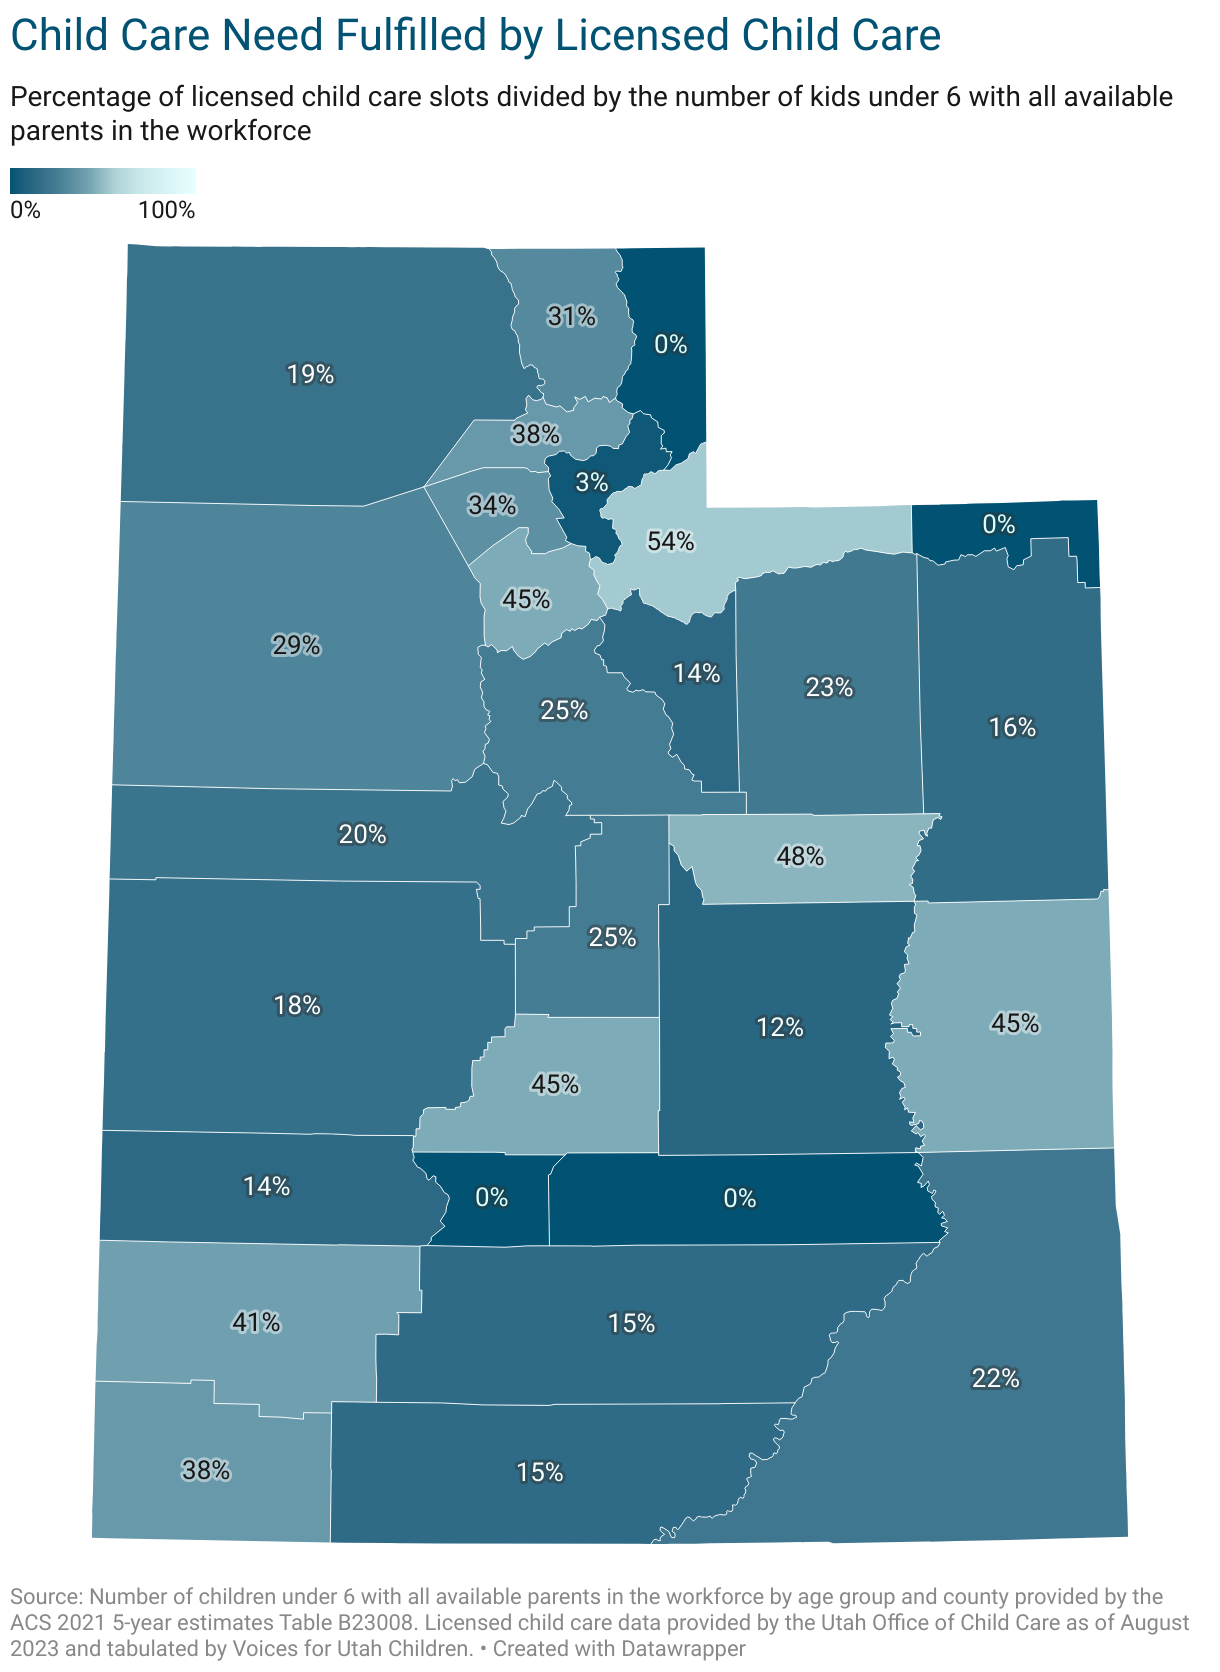
Utah’s family demographics have changed. 53% of Utah families have all available parents in the workforce, making child care a necessity. These days, most Utah families need two incomes to maintain financial stability. But Utah’s licensed child care system struggles to meet the demand. Licensed child care program capacity is only sufficient to serve about 36% of all children under six whose parents are working.
To provide a comprehensive picture of Utah's current child care crisis, this report produced by Voices for Utah Children examines the availability of licensed child care across the state, and in each individual county. By conducting a detailed analysis of both the demand and supply of child care services, the report aims to provide policymakers and the public with a clear understanding of the urgent need for child care reform.
Download a copy of the report here.
County-Level Data
Child Care Access Data Fact Sheets by County are also available on our Utah Care for Kids website. Look up child care access in your county today!
Statewide Data
Children Potentially in Need of Care |
|
| All Children Under 6 Years Old | 289,240 |
| Children Under 6 Years Potentially in Need of Care | 154,229 |
| Rate of Children Under 6 with Potential Child Care Needs | 53% |
Licensed Child Care Programming |
|
| Home-based Child Care Programs | 940 |
| Center-based Child Care Programs | 427 |
| Total Licensed Slots | 54,804 |
| Percent of Child Care Need Met | 36% |
Cost of Care for Families |
|
| Average Annual Cost Home-based Child Care for Infant/Toddler | $8,267 |
| Average Annual Cost Center-based Child Care for Infant/Toddler | $11,232 |
| Average Annual Cost Home-based Child Care for Preschool-Aged Child | $7,311 |
| Average Annual Cost Center-based Child Care for Preschool-Aged Child | $8,487 |
| Number of Children Eligible for Subsidies | 81,805 |
| Number of Children Receiving Subsidies | 11,665 |
| Rate of Eligible Children Receiving Subsidies | 14% |
Child Care Workforce Compensation |
|
| Median Hourly Wage for Child Care Professionals | $12.87 |
| Median Annual Salary for Child Care Professionals | $26,770 |
Takeaways
There is insufficient licensed child care in Utah to meet the needs of working families.
There are more than 154,000 children under the age of six living in Utah with all available parents in the workforce. But, there are only 54,804 licensed child care spots in 1,367 programs statewide. Licensed child care program capacity is only sufficient to serve about 36% of all children under six whose parents are working. That means the working families of nearly two-thirds of Utah’s youngest children must rely on alternate arrangements (such as utilizing family members, hiring or sharing a nanny, alternating parent work schedules, using unlicensed child care providers, or some combination of these).
The high cost of child care makes it even less accessible to low- and middle-income families, and rural families struggle most.
Affordability remains a significant hurdle with child care costs often consuming a substantial portion of a family’s income. The U.S. Department of Health and Human Services defines affordable child care as care that costs no more than 7% of a family's income. In Utah, the average annual cost of care for two children under the age of six (one infant, one preschool-aged child is $16,890, taking up about 17% of family’s income. For a family in rural Grand County, the cost of that care is actually higher at $17,339, consuming 41% of their income. The lack of dramatic differences in child care prices from county to county is an illustration of how little flexibility providers have to reduce tuition costs for parents, even in areas of the state where family incomes clearly can’t keep up.
How costs play out for a typical four-person family with one infant/toddler and one preschool-aged child |
|
| Median Four-Person Family Household Income | $100,752 |
| Average Annual Cost of Toddler/Infant Care | $9,193 |
| Average Annual Cost of Preschool-Aged Care | $7,678 |
| Considered "Affordable" Child Care for this Family | $7,053 |
| Average Amount this Family Will Spend on Child Care | $16,871 |
| Percent of Income this Family Will Spend on Child Care | 17% |
Licensed child care is insufficient in every county in Utah, though the level of unmet need varies from place to place.
Summit County emerges as the county with the highest percentage of child care need met (54%), followed by Carbon, (48%) Sevier (45%), Grand (45%), Salt Lake (45%), and Iron Counties (41%). All other counties have less than 40% of child care need met with licensed program capacity, and multiple rural counties (Daggett, Piute, Rich, and Wayne) have no licensed child care available at all.
With substantial public investment, Utah’s child care system has grown 31% since the start of the COVID pandemic.
Through various federal funding streams, nearly $600 million has worked to grow Utah’s child care capacity from approximately 42,000 licensed slots in March 2020 to over 54,000 in August 2023. In contrast to many other states, Utah has managed to increase its licensed child care capacity - despite substantial pandemic disruptions - through stabilization grants paid directly to existing providers for wage supplementation, startup support for new programs, and a one-time worker bonus of $2,000 per child care professional. These financial investments both expanded the enrollment capacities of existing programs as well as recruited new providers into the sector. However, with the ending of this funding in October 2023, Utah risks jeopardizing this incredible progress.
Recommendations
1. Commit to Public Investment in Child Care
Utah’s child care crisis requires public investment. Funding is needed to bridge the gap between what families can afford and the true cost of care. While businesses can contribute, their capacity to address this crisis is limited. There is no sufficient source of investment to address child care’s market failure aside from public funding. Child care should be valued in the same ways as the public education system, ensuring equal access and opportunities for all children. Currently, the burden of expensive early education falls largely on Utah families, with minimal public support, even though most brain development occurs before age six.
2. Help Parents Afford the Care They Want
Utah’s current child care system doesn’t promote parent choice. Child care affordability and accessibility severely limit family choice when it comes to child care, forcing decisions based on cost or access, rather than preference. This also impacts family planning and career choices. Parents are forced to make difficult choices, such as changing jobs, adjusting school and work schedules, or choosing suboptimal child care situations. To address these issues, policymakers should consider improving the child care subsidy program, expanding the child tax credit, and finding ways to help alleviate the financial burden on Utah families.
3. Support the Critical Work of Child Care Professionals
Child care professionals face significant financial challenges. Low wages and a lack of benefits, including healthcare and retirement, have made the profession unsustainable, leading to high rates of turnover each year. Since Utah’s current child care system only meets 36% of the state's need, Utah must invest in the early child care profession to attract and retain a robust workforce. To support child care providers, policymakers should consider measures including state funding of Child Care Stabilization Grants, wage supplement programs, eliminating barriers to licensure, and increasing access to employment benefits.
For questions or inquiries regarding this report, please contact Voices staff members:
It’s Official: Access to Licensed Child Care Statewide is Really Bad (and Getting Worse)
We know that Utah’s child care crisis is bad, and is going to get worse. New data helps illustrate exactly how bad the situation is, in each county across the state.
Next week Voices for Utah Children will release a report titled, “Mapping Care for Kids: A County-Level Look at Utah’s Crisis in Licensed Child Care.” The report includes more detailed county-level analysis and data highlighting the inaccessibility of care and financial challenges faced by families and child care professionals. In addition, the report includes policy recommendations for Utah leaders to help resolve this crisis.
The full report will be available the week of October 23rd, but as a teaser, this blog highlights some key findings from the report.
There is insufficient licensed child care in Utah to meet the needs of working families.
Licensed child care program capacity is only sufficient to serve about 36% of all children under six whose parents are working. Parents face shortages in every county statewide, with rural families struggling most.
The high cost of child care makes it even less accessible to low- and middle-income families, and rural families struggle most.
The average annual cost of care for two children under the age of six (one infant/toddler, one preschool-aged child) for a Utah family costs about 17% of a 4-person family’s income. Cost varies little between rural and urban counties, but on average household median incomes are lower in rural areas. In Grand County, with the state’s lowest median annual income at $42,654, the cost of care for a family of four would comprise about 41% of a family’s income.
Child care providers receive insufficient compensation, and have few incentives to stay in the field.
Child care providers typically earn low wages and very limited benefits. The median hourly wage for child care professionals in Utah is just $12.87 per hour ($26,770/year), less than they could make as professional dog walkers. The poverty rate among child care providers in Utah is 23.1%, more than 8 times higher than that of K-8 teachers.
With substantial public investment, Utah’s licensed child care capacity has grown significantly since the start of the COVID-19 pandemic.
Thanks to federal funding streams totaling nearly $600 million, licensed child care capacity in Utah has grown by approximately 31% since March 2020. This growth is due primarily to child care stabilization grants made directly to licensed child care providers; those grants recently were reduced by 75%. Utah has been identified as one of six states that could see half or more of all licensed child care programs statewide close with the end of the stabilization grants.
Licensed child care is insufficient in every county in Utah, though the level of unmet need varies from place to place.
How does child care access and affordability compare in each county?
Our full report, “Mapping Care for Kids: A County-Level Look at Utah’s Crisis in Licensed Child Care” will be released the week of October 23rd. For questions about the report, this blog, or sources and methodology, please contact Jenna Williams at . For more information on efforts to improve Utah’s child care system or learn about the child care advocacy network, visit utahchildren.org/issues/early-childhood-education and utahcareforkids.org.
Full Steam Ahead for Full-Day Kindergarten in Utah!
Congratulations, Utah parents and educators! Together, we did it. Funding for optional full-day kindergarten is now a reality for schools statewide.
The Utah Legislature passed HB477, "Full Day Kindergarten Amendments," sponsored by Rep. Robert Spendlove (R-Sandy). This bill establishes the same flexible, stable funding stream for full-day kindergarten as currently exists for all other grades of public school, first through twelfth. Last week, Governor Spencer Cox signed this historic bill into law!
(Click here to jump to our four-minute explainer video, which is also included at the bottom of this page)
Does this mean that next school year, every family in Utah will have the opportunity to enroll their kindergartner in a full-day program in their neighborhood school? Unfortunately, no. It DOES mean that the number of families who will have access to full-day kindergarten will increase dramatically - we estimate between 60% and 65% of kindergarteners will be able to enroll in an optional full-day program during the 2023-24 school year. This is is a huge leap from fewer than 25% just five years ago!
The passage of HB477 means that next school year (2023-24), every district and charter elementary school will have the opportunity to offer optional full-day kindergarten, using this new state funding stream.
In order to offer more full-day kindergarten, schools must have more classroom space, more teachers, and more equipment like tables and chairs. Some school districts and charter schools have spent the last several years making plans to overcome these challenges, and will be ready to offer optional full-day kindergarten to most, if not all, of their local families in the coming school year.
Some elementary schools are not quite ready to take advantage of this opportunity. These schools will need some time to overcome the challenges of: 1) limited classroom space; 2) recruiting new teachers; 3) purchasing new materials and equipment; 4) busing adjustments; and other practical issues. This is true particularly in some of our large, suburban school districts, such as Jordan, Davis and Alpine. Other small- and mid-size districts face some of these issues, as well.
We estimate that it will take between three and five years before all Utah families have the opportunity to enroll their child in a full-day kindergarten program. Based on the popularity of newly expanded full-day programs in different parts of the state, we expect to see more than 90% of parents opt for full-day kindergarten for their children when it becomes available to them.
The best way to find out whether your local elementary will be offering optional full-day kindergarten during the 2023-24 school year is to contact the current principal of that school (or the director, in case of charter schools) and ask them directly! Not only will this help you to plan for your family's schooling schedules, but it will help our local education leaders assess how much community interest exists for more optional full-day kindergarten.
In case you were worried, the new law preserves parents' right to enroll their child in a half-day program, and does not make kindergarten mandatory. There is nothing in the law that tells districts and charters how much optional full-day kindergarten they must offer to their communities, or how soon they have to do so. HB477 was created to be as flexible as possible, allowing local communities to decide the right mix of half- and full-day programming for them.
Thanks to all the hard work of education leaders, insistent parents and committed community advocates, we have finally accomplished state funding for optional full-day kindergarten in Utah! We especially appreciate the commitment of the United Way of Salt Lake and the Utah PTA, our core partners in the Utah Full-Day Kindergarten Now Coalition.
Of course, this would not have happened without the support and leadership of State Superintendent Sydnee Dickson, Sara Wiebke, Christine Elegante and other superhero staff at the Utah State Board of Education. We owe a lot to our bill sponsor, Rep. Spendlove, and the other legislative champions like Senator Ann Millner who have been key to this effort in the past (former Reps. Lowry Snow and Steve Waldrip, we are looking at you!).
Utah Education Funding: Legislative Leadership vs The Data
At two large pre-legislative events in the second week of January, hundreds of attendees heard Utah's Senate President proudly assert that Utah was the only state that increased education funding during the pandemic.
Every year, especially around the end of every legislative session, Utah's political leaders proclaim that they are putting record amounts of funding into education.
Unfortunately, these claims are contradicted by the data published by the Utah State Board of Education in its Superintendent's Annual Report.
Real FY21 and FY22 State + Local Education Funding Did Not Rise -- It Fell
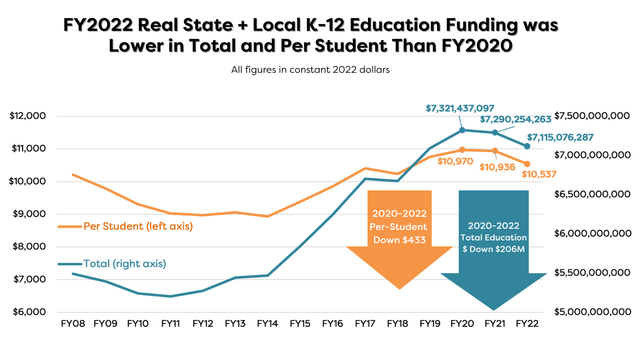
These data are from the USBE Superintendent's Annual Reports, adjusted for inflation using the standard CPI-U inflation index from the federal Bureau of Labor Statistics. They show that Utah's real (inflation-adjusted) state + local education funding fell in both FY21 and FY22, both in total and on a per-student basis. (During those two fiscal years, the Utah Legislature passed over $300 million in income tax cuts.)
State Education Funding Has Fallen While Local Education Funding Has Risen

We have heard legislative leaders assert every year that they have appropriated record amounts for education. We have also sometimes heard them say that local education funding (from property taxes) has not kept up, and that is the reason that overall education funding is inadequate to reduce Utah's largest-in-the-nation class sizes or address our high rates of new teacher turnover. Yet the data from USBE show two trends that contradict these claims, as illustrated in the chart above:
- Real per-student state education funding was 2.5% lower in 2022 than in 2008 (the peak year for education funding before the Great Recession).
- Real per-student local education funding was 12% higher in 2022 than in 2008.
It is also worth noting, in this context, that permanently cutting the state income tax rate, as the Legislature has done in recent years and is considering doing once again this year, tends to put additional pressure on local property taxes to make up the difference for schools. The income tax and the property tax are the two main sources of funding for education. If policymakers intentionally and repeatedly undermine one of them, that inevitably creates pressure to increase the other (or allow it to increase naturally, as has happened the last two years with property taxes as home values have shot up).
Can We Have Record Education Funding and Record Tax Cuts?
Legislative leaders have used their incorrect claims that Utah increased education funding during the pandemic to bolster their case that Utah can have it all -- record high levels of education funding and record tax cuts. But USBE data reveal that, in fact, we cannot have it all, that tradeoffs exist, and that hard choices must be made. If we have record tax cuts, we likely will not have record levels of education funding. If we want to strengthen education finance for the long-term betterment of our children and our state, we ought to consider what we are giving up when we give in to the tax cut temptation.
One Final Comment: Inputs vs Outcomes
Needless to say, this entire discussion concerns only inputs to, not outcomes of, our K-12 public education system. But, as one superintendent wisely observed over a decade ago, "We cannot have the best school system in the country and be the lowest in the country in funding. We can't be first if we're always last."
While there is little doubt that Utah does more with less in our public schools better than probably any other state, there are several key educational outcome measures that most concern Voices for Utah Children:
- Our high school graduation rates are no higher than or below national averages for nearly every racial and ethnic category.
- Our high school graduation rate gaps between haves and have-nots and between majority and minority groups are larger than nationally.
- Our rate of college degrees, an area where Utah's older generations outpaced the nation, has fallen behind the nation's among our younger generation, the Millennial generation, based on Census data for Utahns age 25-34.
Closing these gaps and regaining our once enviable lead will require substantial new investments at every step in the pipeline, from expanding pre-K and full-day kindergarten options to reducing class sizes and new teacher turnover in our elementary, middle, and high schools, to ensuring that more of our sons and daughters finish what they start at our public colleges and universities.
Note: The charts in this blog post are from Voices for Utah Children's forthcoming "Children's Budget Report 2023" that will be published in February 2023.
Both graphs are available for download here.
Methodology and Location of Data
Utah’s education funding rises each year, but so does the student population. And prices rise due to inflation, which has been worse the last year than in 40 years. So how can we judge whether education funding is really going up, as our political leaders always claim? There is one metric considered to be the gold standard for this purpose: inflation-adjusted per-student spending. To calculate this metric, you need three pieces of data. The locations of these items are detailed below:
1. State, Local, and Federal Education Spending
Source: Utah State Board of Education Superintendent’s Annual Report at www.schools.utah.gov/superintendentannualreport
Direct Document Link: Statewide Total: Revenue and Expenditures by Fund, June 30, 2022 https://www.schools.utah.gov/file/674392fc-3946-4ba2-ba19-da7f024f3fe5
Comments: In the charts above, we used the state and local education spending data
2. K-12 Student Population
Source: Utah State Board of Education Superintendent’s Annual Report at www.schools.utah.gov/superintendentannualreport
Direct Document Link: Fall Enrollment by Grade Level and Demographics, October 1, School Year 2022-2023 https://www.schools.utah.gov/file/5c8e2fac-55dc-4f0a-bf6a-6889133e4ffe
Comments: Be sure to use the fall enrollment data from the fall of the year you are analyzing. For example, for FY/SY22, use October 2021 enrollment data.
3. Inflation Index CPI-U
Source: US Bureau of Labor Statisticshttps://www.bls.gov/data/home.htm
Direct Document Link: All Urban Consumers (Current Series) (Consumer Price Index - CPI) https://data.bls.gov/cgi-bin/surveymost?cu U.S. city average, All items - CUUR0000SA0....then use “Annual Averages”
Google Sheet with all collected data, sources & formulas
https://docs.google.com/spreadsheets/d/1fTy8wKHY6Di33eRLTcM7Ce1B5Caw10sb/edit#gid=534909710
Invest in Utah's Future Coalition: $5.6b of unmet needs should be prioritized over tax cuts
Digital Media Policies & Kids: The need for more thoughtful approaches to solutions

By Sariah Villalon (Voices Policy Intern)
We live in a digital world where social media has become integral to our society. It has broadened our communication, allowing us to connect and share information with anyone around the world. It has helped bring awareness to many issues and achievements within our society. But let's face it, unintended risks and consequences come with every innovation. One of them is its effect on our mental health, especially our young people's mental health.
Over the years, there has been an increase in depression, anxiety, and suicide among the youth, especially among girls. Social media may influence these mental health problems through social comparison, cyberbullying, and exposure to other toxic content (Nesi, 2020).
Governor Spencer Cox recently addressed the relationship between social media on the mental health of our youth and how we could improve the mental health of our youth in Utah. Some of his recommendations are the following:
- Hold social media companies accountable by providing tools for parents to safeguard their children,
- Implement a cell phone-free environment in schools to reduce distraction for students.
- Encourage parents to set an example for their children by spending quality social time with one another without social media use.
- Educate their children on what is appropriate to say on these platforms.
- Monitor their children's social media use by using different tools.
- Have an honest conversation about social media
There are multiple good points that the governor pointed out. We agree that social media companies need to be held accountable for the algorithm and design of their apps that provide a toxic environment for their users. A couple of legislative efforts have been created to hold social media responsible. But is it enough?
We do not see so much urgency from these big techs. Even if they get fined, they could pay everything off quickly. It also puts too much burden on the parents to monitor and safeguard their children. We also have to be honest that we cannot blame everything on these companies. So, what can we do?
We need to hold these social media companies responsible by making them contribute to funding social media education for the youth. Organizations such as Digital Respons-Ability train parents, students, and educators on digital citizenship.
We cannot escape the digital world, and it will only progress from here on. We need to teach our youth how to use the technology and social media they have properly. Removing phones during school time will not solve our problems. By educating the youth, they can be better equipped to make informed decisions for their lives and improve their learning.
Another is research on the effect of social media on youth mental health. As we know, mental health is multi-faceted. We cannot just say that one factor causes mental health problems. We need more longitudinal studies on its effects to counter better or mitigate its adverse effects.
More importantly, let's talk more openly about our mental health. Let us educate ourselves and share our experiences with our children so they can also be aware of their well-being. Give them the resources to improve or manage their mental health. When children are more knowledgeable, it can increase their chances of knowing when and where to get the help they might need.
Learn more on how we can help through this video. You can also download this infographic on Youth Mental Health & Digital Media for more information.