Issues
Tax and Budget
Utah’s family demographics have changed. 53% of Utah families have all available parents in the workforce, making child care a necessity. These days, most Utah families need two incomes to maintain financial stability. But Utah’s licensed child care system struggles to meet the demand. Licensed child care program capacity is only sufficient to serve about 36% of all children under six whose parents are working.
To provide a comprehensive picture of Utah's current child care crisis, this report produced by Voices for Utah Children examines the availability of licensed child care across the state, and in each individual county. By conducting a detailed analysis of both the demand and supply of child care services, the report aims to provide policymakers and the public with a clear understanding of the urgent need for child care reform.
Download a copy of the report here.
County-Level Data
Child Care Access Data Fact Sheets by County are also available on our Utah Care for Kids website. Look up child care access in your county today!
Statewide Data
Children Potentially in Need of Care |
|
| All Children Under 6 Years Old | 289,240 |
| Children Under 6 Years Potentially in Need of Care | 154,229 |
| Rate of Children Under 6 with Potential Child Care Needs | 53% |
Licensed Child Care Programming |
|
| Home-based Child Care Programs | 940 |
| Center-based Child Care Programs | 427 |
| Total Licensed Slots | 54,804 |
| Percent of Child Care Need Met | 36% |
Cost of Care for Families |
|
| Average Annual Cost Home-based Child Care for Infant/Toddler | $8,267 |
| Average Annual Cost Center-based Child Care for Infant/Toddler | $11,232 |
| Average Annual Cost Home-based Child Care for Preschool-Aged Child | $7,311 |
| Average Annual Cost Center-based Child Care for Preschool-Aged Child | $8,487 |
| Number of Children Eligible for Subsidies | 81,805 |
| Number of Children Receiving Subsidies | 11,665 |
| Rate of Eligible Children Receiving Subsidies | 14% |
Child Care Workforce Compensation |
|
| Median Hourly Wage for Child Care Professionals | $12.87 |
| Median Annual Salary for Child Care Professionals | $26,770 |
Takeaways
There is insufficient licensed child care in Utah to meet the needs of working families.
There are more than 154,000 children under the age of six living in Utah with all available parents in the workforce. But, there are only 54,804 licensed child care spots in 1,367 programs statewide. Licensed child care program capacity is only sufficient to serve about 36% of all children under six whose parents are working. That means the working families of nearly two-thirds of Utah’s youngest children must rely on alternate arrangements (such as utilizing family members, hiring or sharing a nanny, alternating parent work schedules, using unlicensed child care providers, or some combination of these).
The high cost of child care makes it even less accessible to low- and middle-income families, and rural families struggle most.
Affordability remains a significant hurdle with child care costs often consuming a substantial portion of a family’s income. The U.S. Department of Health and Human Services defines affordable child care as care that costs no more than 7% of a family's income. In Utah, the average annual cost of care for two children under the age of six (one infant, one preschool-aged child is $16,890, taking up about 17% of family’s income. For a family in rural Grand County, the cost of that care is actually higher at $17,339, consuming 41% of their income. The lack of dramatic differences in child care prices from county to county is an illustration of how little flexibility providers have to reduce tuition costs for parents, even in areas of the state where family incomes clearly can’t keep up.
How costs play out for a typical four-person family with one infant/toddler and one preschool-aged child |
|
| Median Four-Person Family Household Income | $100,752 |
| Average Annual Cost of Toddler/Infant Care | $9,193 |
| Average Annual Cost of Preschool-Aged Care | $7,678 |
| Considered "Affordable" Child Care for this Family | $7,053 |
| Average Amount this Family Will Spend on Child Care | $16,871 |
| Percent of Income this Family Will Spend on Child Care | 17% |
Licensed child care is insufficient in every county in Utah, though the level of unmet need varies from place to place.
Summit County emerges as the county with the highest percentage of child care need met (54%), followed by Carbon, (48%) Sevier (45%), Grand (45%), Salt Lake (45%), and Iron Counties (41%). All other counties have less than 40% of child care need met with licensed program capacity, and multiple rural counties (Daggett, Piute, Rich, and Wayne) have no licensed child care available at all.
With substantial public investment, Utah’s child care system has grown 31% since the start of the COVID pandemic.
Through various federal funding streams, nearly $600 million has worked to grow Utah’s child care capacity from approximately 42,000 licensed slots in March 2020 to over 54,000 in August 2023. In contrast to many other states, Utah has managed to increase its licensed child care capacity - despite substantial pandemic disruptions - through stabilization grants paid directly to existing providers for wage supplementation, startup support for new programs, and a one-time worker bonus of $2,000 per child care professional. These financial investments both expanded the enrollment capacities of existing programs as well as recruited new providers into the sector. However, with the ending of this funding in October 2023, Utah risks jeopardizing this incredible progress.
Recommendations
1. Commit to Public Investment in Child Care
Utah’s child care crisis requires public investment. Funding is needed to bridge the gap between what families can afford and the true cost of care. While businesses can contribute, their capacity to address this crisis is limited. There is no sufficient source of investment to address child care’s market failure aside from public funding. Child care should be valued in the same ways as the public education system, ensuring equal access and opportunities for all children. Currently, the burden of expensive early education falls largely on Utah families, with minimal public support, even though most brain development occurs before age six.
2. Help Parents Afford the Care They Want
Utah’s current child care system doesn’t promote parent choice. Child care affordability and accessibility severely limit family choice when it comes to child care, forcing decisions based on cost or access, rather than preference. This also impacts family planning and career choices. Parents are forced to make difficult choices, such as changing jobs, adjusting school and work schedules, or choosing suboptimal child care situations. To address these issues, policymakers should consider improving the child care subsidy program, expanding the child tax credit, and finding ways to help alleviate the financial burden on Utah families.
3. Support the Critical Work of Child Care Professionals
Child care professionals face significant financial challenges. Low wages and a lack of benefits, including healthcare and retirement, have made the profession unsustainable, leading to high rates of turnover each year. Since Utah’s current child care system only meets 36% of the state's need, Utah must invest in the early child care profession to attract and retain a robust workforce. To support child care providers, policymakers should consider measures including state funding of Child Care Stabilization Grants, wage supplement programs, eliminating barriers to licensure, and increasing access to employment benefits.
For questions or inquiries regarding this report, please contact Voices staff members:
Utah Education Funding: Legislative Leadership vs The Data
At two large pre-legislative events in the second week of January, hundreds of attendees heard Utah's Senate President proudly assert that Utah was the only state that increased education funding during the pandemic.
Every year, especially around the end of every legislative session, Utah's political leaders proclaim that they are putting record amounts of funding into education.
Unfortunately, these claims are contradicted by the data published by the Utah State Board of Education in its Superintendent's Annual Report.
Real FY21 and FY22 State + Local Education Funding Did Not Rise -- It Fell
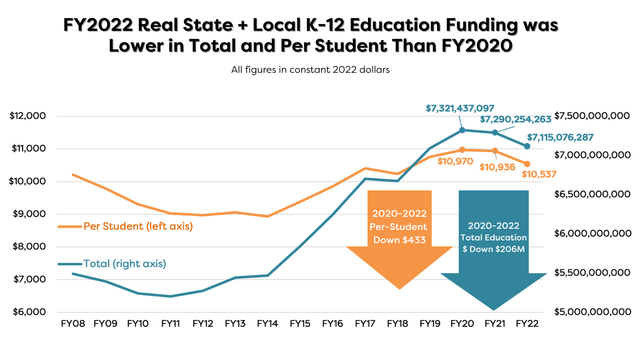
These data are from the USBE Superintendent's Annual Reports, adjusted for inflation using the standard CPI-U inflation index from the federal Bureau of Labor Statistics. They show that Utah's real (inflation-adjusted) state + local education funding fell in both FY21 and FY22, both in total and on a per-student basis. (During those two fiscal years, the Utah Legislature passed over $300 million in income tax cuts.)
State Education Funding Has Fallen While Local Education Funding Has Risen

We have heard legislative leaders assert every year that they have appropriated record amounts for education. We have also sometimes heard them say that local education funding (from property taxes) has not kept up, and that is the reason that overall education funding is inadequate to reduce Utah's largest-in-the-nation class sizes or address our high rates of new teacher turnover. Yet the data from USBE show two trends that contradict these claims, as illustrated in the chart above:
- Real per-student state education funding was 2.5% lower in 2022 than in 2008 (the peak year for education funding before the Great Recession).
- Real per-student local education funding was 12% higher in 2022 than in 2008.
It is also worth noting, in this context, that permanently cutting the state income tax rate, as the Legislature has done in recent years and is considering doing once again this year, tends to put additional pressure on local property taxes to make up the difference for schools. The income tax and the property tax are the two main sources of funding for education. If policymakers intentionally and repeatedly undermine one of them, that inevitably creates pressure to increase the other (or allow it to increase naturally, as has happened the last two years with property taxes as home values have shot up).
Can We Have Record Education Funding and Record Tax Cuts?
Legislative leaders have used their incorrect claims that Utah increased education funding during the pandemic to bolster their case that Utah can have it all -- record high levels of education funding and record tax cuts. But USBE data reveal that, in fact, we cannot have it all, that tradeoffs exist, and that hard choices must be made. If we have record tax cuts, we likely will not have record levels of education funding. If we want to strengthen education finance for the long-term betterment of our children and our state, we ought to consider what we are giving up when we give in to the tax cut temptation.
One Final Comment: Inputs vs Outcomes
Needless to say, this entire discussion concerns only inputs to, not outcomes of, our K-12 public education system. But, as one superintendent wisely observed over a decade ago, "We cannot have the best school system in the country and be the lowest in the country in funding. We can't be first if we're always last."
While there is little doubt that Utah does more with less in our public schools better than probably any other state, there are several key educational outcome measures that most concern Voices for Utah Children:
- Our high school graduation rates are no higher than or below national averages for nearly every racial and ethnic category.
- Our high school graduation rate gaps between haves and have-nots and between majority and minority groups are larger than nationally.
- Our rate of college degrees, an area where Utah's older generations outpaced the nation, has fallen behind the nation's among our younger generation, the Millennial generation, based on Census data for Utahns age 25-34.
Closing these gaps and regaining our once enviable lead will require substantial new investments at every step in the pipeline, from expanding pre-K and full-day kindergarten options to reducing class sizes and new teacher turnover in our elementary, middle, and high schools, to ensuring that more of our sons and daughters finish what they start at our public colleges and universities.
Note: The charts in this blog post are from Voices for Utah Children's forthcoming "Children's Budget Report 2023" that will be published in February 2023.
Both graphs are available for download here.
Methodology and Location of Data
Utah’s education funding rises each year, but so does the student population. And prices rise due to inflation, which has been worse the last year than in 40 years. So how can we judge whether education funding is really going up, as our political leaders always claim? There is one metric considered to be the gold standard for this purpose: inflation-adjusted per-student spending. To calculate this metric, you need three pieces of data. The locations of these items are detailed below:
1. State, Local, and Federal Education Spending
Source: Utah State Board of Education Superintendent’s Annual Report at www.schools.utah.gov/superintendentannualreport
Direct Document Link: Statewide Total: Revenue and Expenditures by Fund, June 30, 2022 https://www.schools.utah.gov/file/674392fc-3946-4ba2-ba19-da7f024f3fe5
Comments: In the charts above, we used the state and local education spending data
2. K-12 Student Population
Source: Utah State Board of Education Superintendent’s Annual Report at www.schools.utah.gov/superintendentannualreport
Direct Document Link: Fall Enrollment by Grade Level and Demographics, October 1, School Year 2022-2023 https://www.schools.utah.gov/file/5c8e2fac-55dc-4f0a-bf6a-6889133e4ffe
Comments: Be sure to use the fall enrollment data from the fall of the year you are analyzing. For example, for FY/SY22, use October 2021 enrollment data.
3. Inflation Index CPI-U
Source: US Bureau of Labor Statisticshttps://www.bls.gov/data/home.htm
Direct Document Link: All Urban Consumers (Current Series) (Consumer Price Index - CPI) https://data.bls.gov/cgi-bin/surveymost?cu U.S. city average, All items - CUUR0000SA0....then use “Annual Averages”
Google Sheet with all collected data, sources & formulas
https://docs.google.com/spreadsheets/d/1fTy8wKHY6Di33eRLTcM7Ce1B5Caw10sb/edit#gid=534909710