
About this Map
Utah is often recognized as a good place to raise a family. In the Annie E. Casey Foundation's 2026 KIDS COUNT® Data Book, Utah ranks 3rd in the nation for overall child well-being. Here's how the state ranks in each of the Data Book's four areas:
- 2nd in Family and Community
- 5th in Education
- 7th in Economic Well-Being
- 12th in Health
These rankings tell us something important: compared with many other states, Utah’s children are doing well.
But they do not tell us the whole story.
A statewide ranking can show us how Utah compares with the rest of the country, but it cannot always show us what childhood looks like from one Utah community to another. And for families, those differences can be significant.
For more than 20 years, Voices for Utah Children has worked through the Utah KIDS COUNT Project to provide reliable information about the well-being of Utah’s children and families. The purpose has never been simply to publish statistics. Good data should help us understand what is happening in our communities, identify emerging challenges, and make better decisions about policies, programs, and investments that affect children.
We are taking another step in that work by presenting KIDS COUNT data in a new way.
Through maps, comparisons, and county-level analysis, we introduce the Prosperity and Geographic Equity Dashboard, which looks beyond statewide averages to ask a deeper question:
Are positive outcomes being experienced by children everywhere in Utah?
Prosperity tells us how well children, families, and communities are doing overall. For each selected indicator, states are compared based on their statewide outcomes.
Geographic equity looks inside the state. It compares outcomes across counties to understand better whether children have similar opportunities and experiences regardless of where they live.
Together, these measures tell a fuller story.
A state can perform very well overall while still having large differences among communities. Another state may not rank as highly nationally, but it may have more consistent outcomes from one county to another.
Looking at both prosperity and geographic equity helps us understand not only how well Utah is doing, but also how widely that well-being is shared.
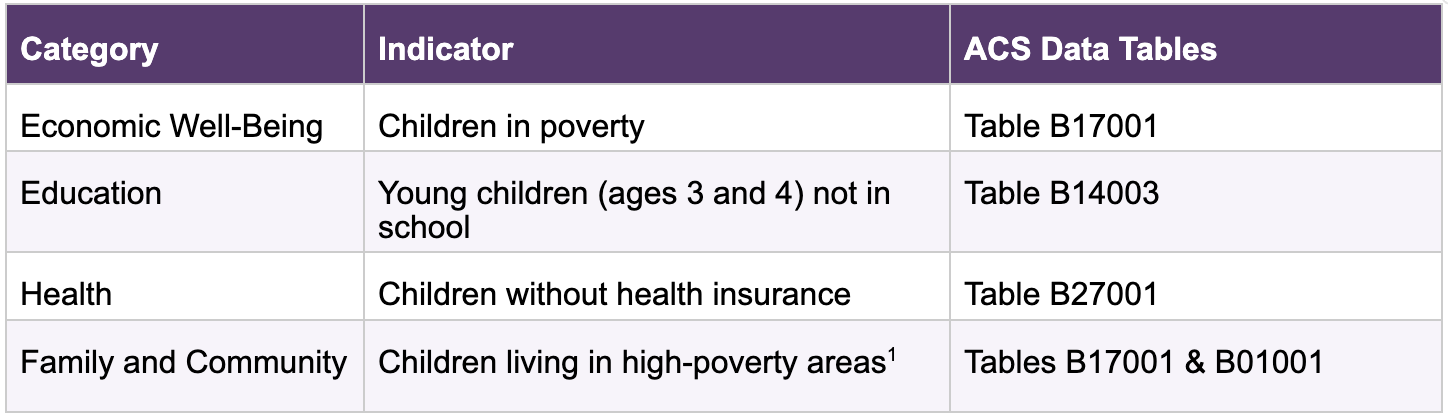
For the first dashboard release, we examine four indicators drawn from the Annie E. Casey Foundation’s national KIDS COUNT Data Book. Each represents one of the major areas used to understand child well-being:
- Children living below the poverty level
- Children not enrolled in preschool
- Children without health insurance
- Children living in high-poverty areas
The goal of this work is not to label one county as “good” and another as “bad.” Utah’s high national ranking is worth recognizing. It tells us that our state has important strengths and that many children are growing up with opportunities that support their well-being. But being among the best-performing states should not be the end of the conversation.
The next question must be whether every child, no matter their county or community, has a genuine chance to succeed and flourish.
That is why geographical equity matters.
It is intended to help us ask better questions, and these are the questions that turn data into something useful. When we look beyond the statewide average, we can see where progress is shared and where gaps remain. When we understand those differences more clearly, policymakers, community leaders, advocates, and residents can make more informed decisions about where resources and solutions are needed most.
If you have any questions regarding the dashboard please email our Kids Count Director, Martín Muñoz at
This is a condensed version of our full explainer, which you can read here.
Methodology
Why This Analysis Exists
The Annie E. Casey Foundation’s national KIDS COUNT® publication measures child well-being using sixteen state-level indicators across four categories and ranks states against one another. These statewide rates provide a useful picture of overall state performance, but they do not show how outcomes may vary across counties within the same state. This analysis adds a complementary layer by examining not only how a state performs on average, but also how evenly that outcome is distributed across its counties.
Indicators and Data Sources
One indicator was selected from each of KIDS COUNT's four categories. All data is from the U.S. Census Bureau's American Community Survey (ACS), 2024, five-year estimates.
The Two Complementary Measures
The following two measures are presented separately to provide a fuller picture of state performance.
Prosperity reflects how well people, families, and communities in a state are able to thrive. It is measured using each state’s overall rate on the selected indicator, with lower adverse-outcome rates receiving stronger rankings.Geographic Equity is assessed by comparing outcomes across counties to identify whether some areas are doing better or facing greater challenges than others, with the goal of understanding whether people have similar opportunities and outcomes regardless of where they live.
How Prosperity and Geographic Equity Are Measured
Prosperity is measured using each state’s overall rate for the selected indicator. Because all four indicators represent adverse outcomes, lower rates correspond to higher prosperity. States are ranked separately for each indicator based on their outcomes.
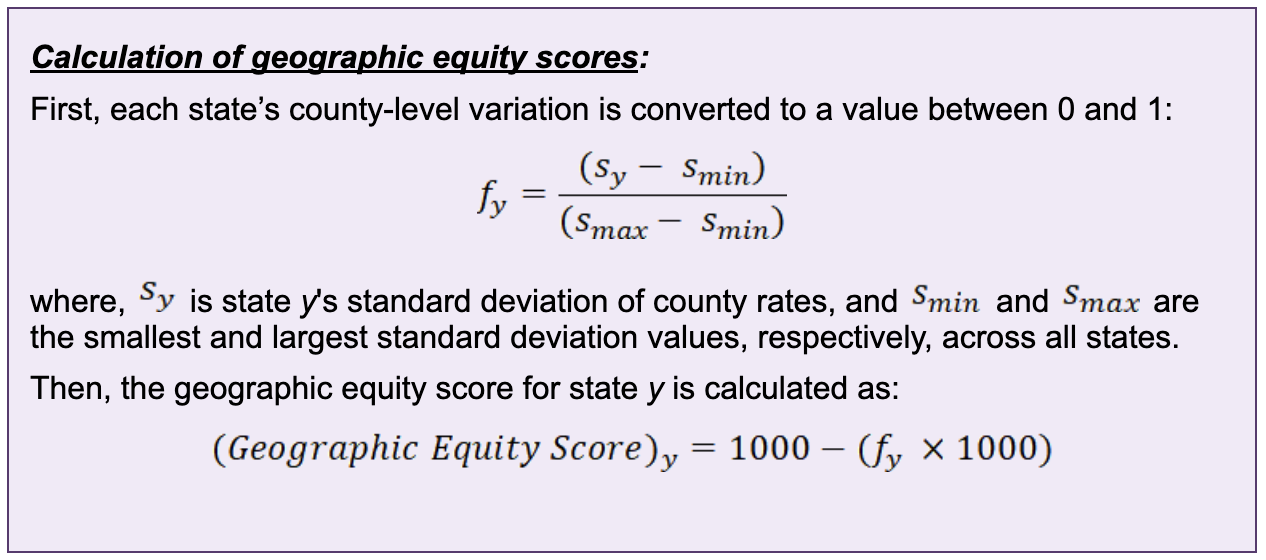
Geographic Equity is measured using the variation in county-level rates within each state for the selected indicator. For each state, we take each county's rate on an indicator and measure how spread out those rates are (the standard deviation). When counties have similar rates, the state has less variation (and hence, a higher geographic equity). When county rates are very different from one another, the state has more variation (and hence, a lower geographic equity). Each county contributes equally to this calculation. The variation is then rescaled onto a 0–1000 geographic equity score by comparing it to other states’ spread on the same indicator. A score of 1,000 means the state has the smallest differences across counties compared to other states (most equitable), while a score of 0 means it has the largest (least equitable). It is important to note that a high geographic equity score means counties in the state have similar outcomes on an indicator, but it does not necessarily mean that those outcomes are good.
Treatment of Uncertain Estimates
A county estimate is flagged as having high statistical uncertainty (⚠️) when its margin of error is greater than 50% of the estimate, or when the estimate is 0% but the margin of error is non-zero. A state is flagged when more than 25% of its counties meet this condition, indicating that its equity score may reflect survey noise. Flagged estimates remain in the calculations to keep the methodology consistent, but warnings are displayed wherever uncertain estimates may affect interpretation of the results.
