Utah is often recognized as a good place to raise a family. In the Annie E. Casey Foundation's 2026 KIDS COUNT® Data Book, Utah ranks 3rd in the nation for overall child well-being. Here's how the state ranks in each of the Data Book's four areas:
- 2nd in Family and Community
- 5th in Education
- 7th in Economic Well-Being
- 12th in Health
Those rankings tell us something important: compared with many other states, Utah’s children are doing well. But they do not tell us the whole story.
A statewide ranking can show us how Utah compares with the rest of the country, but it cannot always show us what childhood looks like from one Utah community to another. And for families, those differences can be significant.
Imagine a child growing up near the ski resorts and affluent communities of Summit County or neighboring Wasatch County. They may see expensive homes, thriving businesses, recreation opportunities, and a community surrounded by resources. The child poverty rate is 3.3% in Summit County and 6.7% in Wasatch County.
Now travel farther south or east.
For a child growing up in Carbon County, daily life may include watching parents stretch each paycheck and make difficult choices about which expenses can wait. In Carbon County, Utah, children face the highest poverty rate, with 21.9% living below the poverty level. Children living in poverty are a significant challenge for the counties that make up the state’s center. Carbon County’s neighbors are not far behind, with Emery County at 21.2% and Sanpete County, home to the Utah governor, at 19.9%.
In Beaver County, a parent may think twice before taking a sick child to the doctor because even a routine visit could add to the family’s financial burden, with the highest rate of children without health insurance coverage at 22.5%.
These communities are only a few hours apart. Yet the opportunities, resources, and challenges children experience can feel much farther apart.
That is the story that statewide averages can sometimes hide.
Looking Beyond a Single Number
For more than 20 years, Voices for Utah Children has worked through the Utah KIDS COUNT Project to provide reliable information about the well-being of Utah’s children and families.
As Utah’s member of the national KIDS COUNT® network, supported by the Annie E. Casey Foundation, we use data to help policymakers, advocates, service providers, community leaders, the media, and the public understand how children are faring and where greater attention is needed.
The purpose has never been simply to publish statistics. Good data should help us understand what is happening in our communities, identify emerging challenges, and make better decisions about policies, programs, and investments that affect children.
Now we’re are taking another step in that work. The new Prosperity and Geographic Equity Dashboard uses maps, comparisons, and county-level analysis, of KIDS COUNT indicators to look beyond statewide averages and ask a deeper question: Are children everywhere in Utah experiencing positive outcomes? Or, as we often ask here at Voices: Is it good for ALL kids?
The dashboard examines child well-being through two related ideas: prosperity and geographic equity.
Prosperity tells us how well children, families, and communities are doing overall. For each selected indicator, states are compared based on their statewide outcomes.
Geographic equity looks inside the state. It compares outcomes across counties to understand better whether children have similar opportunities and experiences regardless of where they live.
Together, these measures tell a fuller story.
A strong prosperity ranking doesn't guarantee that children are doing well in every part of a state.
Take children in poverty, for example. Colorado ranks 5th in prosperity, meaning its statewide child poverty rate is among the lowest. But it ranks 45th in geographic equity, meaning its counties differ widely from one another.
Maine shows the opposite pattern for young children (ages 3 and 4) not enrolled in preschool. It ranks 40th in prosperity but 4th in geographic equity. That means a larger share of Maine's young children are not in preschool than in most states, but the rates are similar from one county to the next.
That's why prosperity rankings alone aren't enough. They show how a state is doing overall, but not whether every community shares in that success. Looking at both measures together shows where strong statewide numbers may be leaving some communities behind, and where a challenge is shared across the whole state.
Four Indicators, Four Windows into Childhood
For the first dashboard release, we examine four indicators drawn from the Annie E. Casey Foundation’s national KIDS COUNT Data Book. Each represents one of the major areas used to understand child well-being:
- Economic Well-Being: Children living below the poverty level
- Education: Children not enrolled in preschool
- Health: Children without health insurance
- Family & Community: Children living in high-poverty areas
Each indicator tells us something different about a child's circumstances.
Economic Well-Being: Children Living Below the Poverty Level
Poverty can affect a family’s ability to consistently afford housing, food, transportation, child care, and other basic needs. This is why it is so vital that all of us listen to Utah’s communities and work with counties like Carbon, Emery, and Sanpete to support their communities and alleviate the poverty that kids in those counties face.
Table 1. Utah Counties with the Lowest and Highest Percentages of Children Living Below the Poverty Level (Top 3 and Bottom 3)
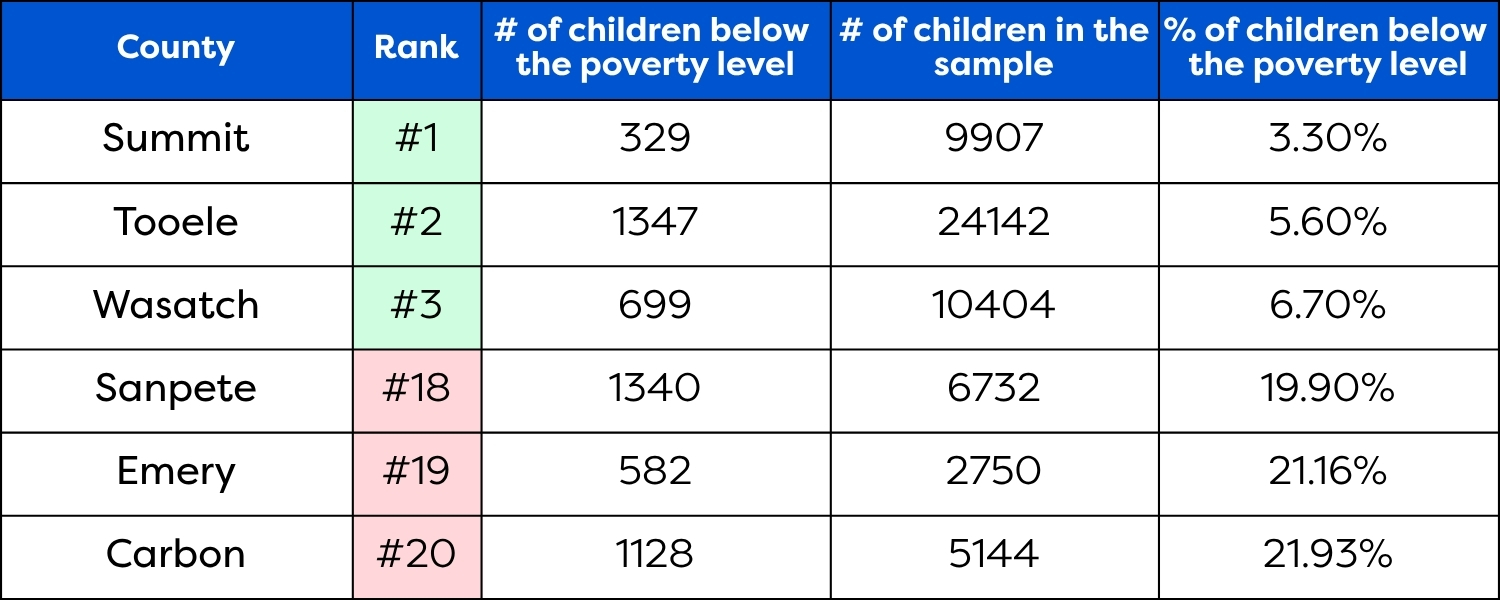
Counties with high statistical uncertainty (not ranked): Rich, Morgan, Daggett, Piute, Beaver, Garfield, Wayne, Kane, Grand.
Education: Children (ages 3-4 years) Not Enrolled in Preschool
Preschool can give young children access to early learning before they enter kindergarten. A quality education is one of the surest ways for each generation to do better than the last, and that can start with affordable, high-quality preschool that gives every child the skills and confidence to become a lifelong learner. Yet in Utah, 57% of 3- and 4-year-olds aren’t enrolled in school, compared with 54% nationally.
Two counties stand out on the dashboard. In Juab County, more than 85% of 3- and 4-year-olds aren’t enrolled in preschool, the highest rate in the state. Travel south on I-15 to Iron County, and the picture is only a little better: more than 78% of young children there aren’t enrolled, the second-highest rate in Utah.
Table 2. Utah Counties with the Lowest and Highest Percentages of Utah children ages 3-4 not enrolled in preschool (Top 3 and Bottom 3)
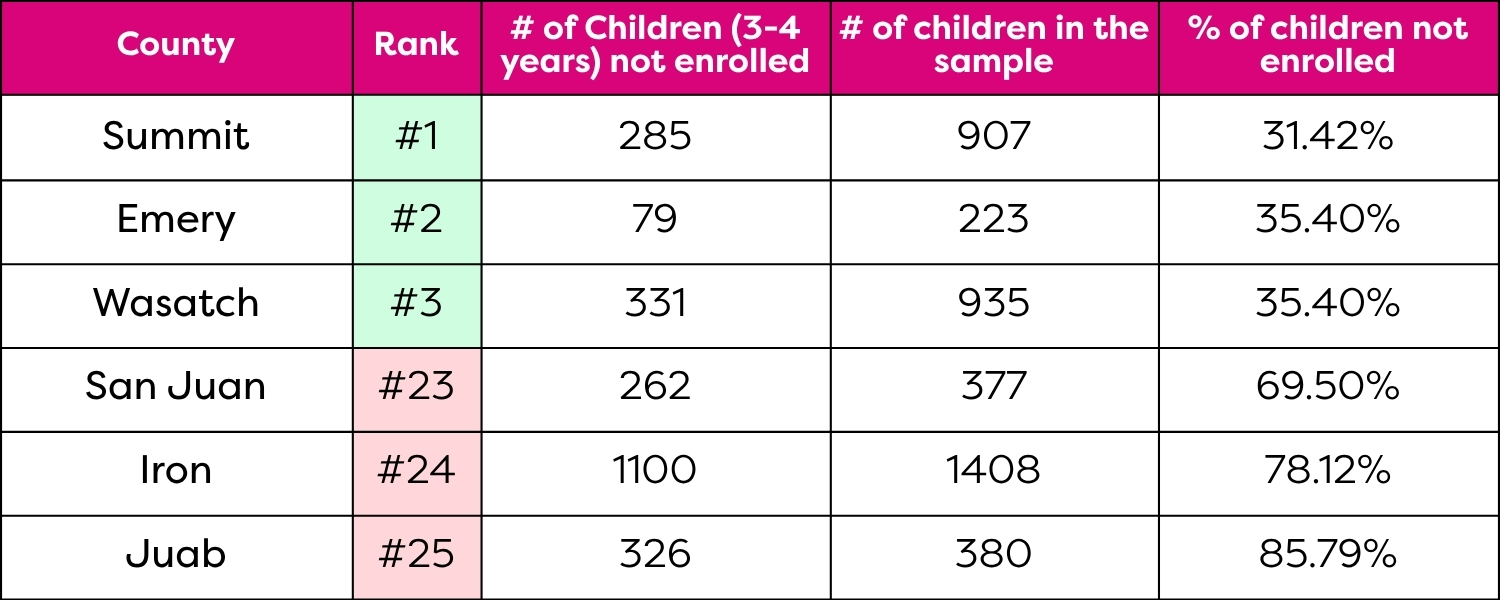
Counties with high statistical uncertainty (not ranked): Daggett, Garfield, Piute, Wayne.
Health: Children Without Health Insurance
Health insurance can determine whether families seek preventive care or get medical help when a child becomes sick. Picture a classroom of 25 students. In Beaver County, which has the highest rate of uninsured children in Utah at 22.5%, about five or six of those students would lack health coverage.
The picture is similar on Utah’s eastern border. In Grand County, home to some of the country’s most famous national parks, more than 18% of children are uninsured, so a broken arm on the trail could become a financial crisis for a family. Neighboring Daggett County isn’t far behind, at 15%.
Table 3. Utah Counties with the Lowest and Highest Percentages of Utah children without health insurance (Top 3 and Bottom 3)
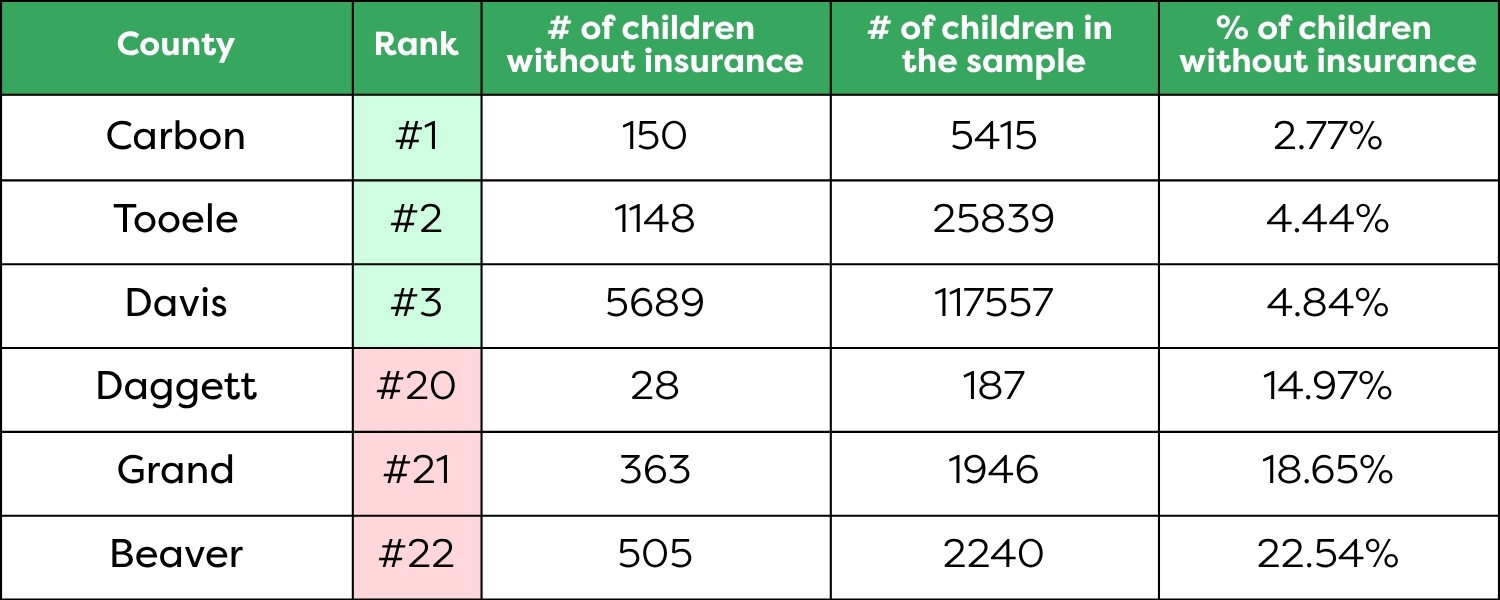
Counties with high statistical uncertainty (not ranked): Piute, Emery, Kane, Morgan, Rich, Garfield, Wayne. Please also note: Beaver County's estimate has a wide margin of error. It falls just under our 50% reliability cutoff, so it is included in this table, but it should be interpreted with caution.
Family & Community: Children Living in High-Poverty Areas
Living in an area of concentrated poverty, where 30% or more of residents live below the poverty level, can shape a child’s access to strong schools, safe neighborhoods, transportation, jobs, and other community resources. Two counties stand out. In San Juan County, more than 40% of children live in high-poverty areas.
In Iron County, the rate is 12.4%, and Iron also has the second-highest share of young children not enrolled in preschool.In places like these, poverty isn’t just a household struggle. It’s woven into the fabric of the neighborhood, and it shapes children’s lives from the start. A child born in one of these communities may face challenges in education, health, economic opportunity, and access to resources before they’ve had any chance to shape their own future. This is sometimes called inherited disadvantage: barriers created by persistent poverty and community underinvestment, passed down from one generation to the next.
That pattern is especially important to understand in San Juan County, where over half of K-12 students are Native American. The county’s high rate of concentrated poverty can’t be separated from generations of systemic neglect, disinvestment, and barriers imposed on Native communities, whose children continue to carry the consequences today.
Table 4. Utah Counties with the Lowest and Highest Percentages of Utah children living in high poverty (HP) areas (Top 3 and Bottom 3)
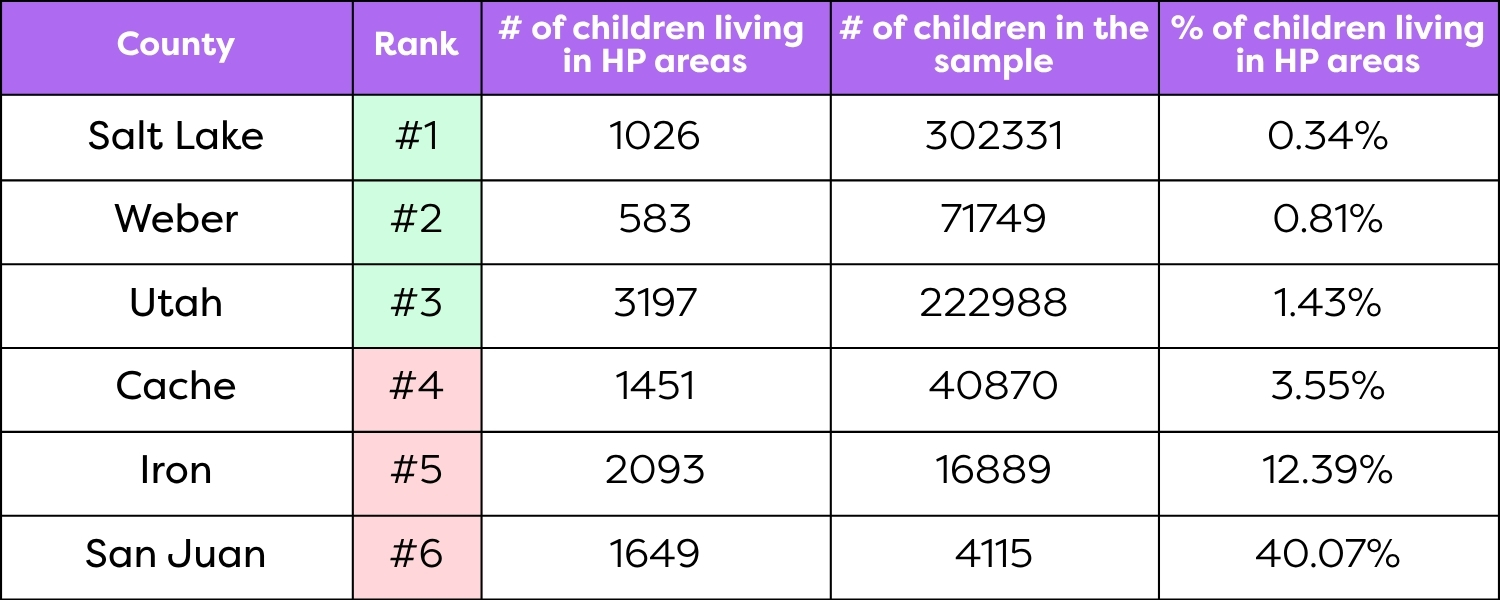
Counties with high statistical uncertainty (not ranked): Beaver, Box Elder, Carbon, Daggett, Davis, Duchesne, Emery, Garfield, Grand, Juab, Kane, Millard, Morgan, Piute, Rich, Sanpete, Sevier, Summit, Tooele, Uintah, Wasatch, Washington, Wayne. (23 of the 29 counties).
Looking at these indicators only at the state level can hide important differences. County-level maps make them easier to see, showing where opportunity is concentrated, where families may face greater hardship, and where a child’s circumstances can change simply by crossing a county line.
Data Should Lead to Better Questions
The goal of this work isn’t to label one county “good” and another “bad.” It’s to help us ask better questions, the kind that turn data into action. And because communities are the experts on their own needs, these questions are best asked with them:
- Why do children experience different outcomes across Utah?
- Which resources or opportunities are more available in some communities than in others?
- What can we learn from counties where children and families are doing especially well?
- Where might additional attention, investment, or policy changes make the greatest difference?
Utah’s high national ranking is worth celebrating. It reflects real strengths and the opportunities many children have to thrive. But being among the best-performing states shouldn’t end the conversation. The next question is whether every child, no matter their county or community, has a genuine chance to succeed.
That’s why geographic equity matters. Looking beyond the statewide average shows where progress is shared and where gaps remain, helping policymakers, community leaders, advocates, and residents decide where resources and solutions are needed most.
Ultimately, Utah’s success shouldn’t be measured only by how highly the state ranks, but by whether children throughout Utah can grow up healthy, secure, supported, and able to reach their full potential.